Time Series Data refers to the same indicator having data for different time periods, or dates. So for example you may have Population Estimates for 2002, 2003, 2004, 2005 and 2006. The indicator is called Population Estimates which has data for 5 dates. In your feature service you would have 5 corresponding fields containing the data values.
It is important to ensure that Report Builder understands which fields contain dates so that it can implement these correctly in widgets. The naming of fields is critical. Report Builder will try to guess from your field name whether it contains a date or not. For example, a field called ‘pop_2000’ would be recognized as an indicator called pop and a date of 2000. However, depending on what your date is, this may not always work e.g. ‘pop_jan’, ‘pop_feb’, etc. would be understood by Report Builder as separate indicators without dates.
To ensure that Report Builder can pick up time series data quickly and correctly from the field name used, you should make use of the pipe symbol (‘|’) to link the indicator name and the date in the field name. The format of the field name is:
<indicator name>|<date> (for example Population|2000 or Population|January.)
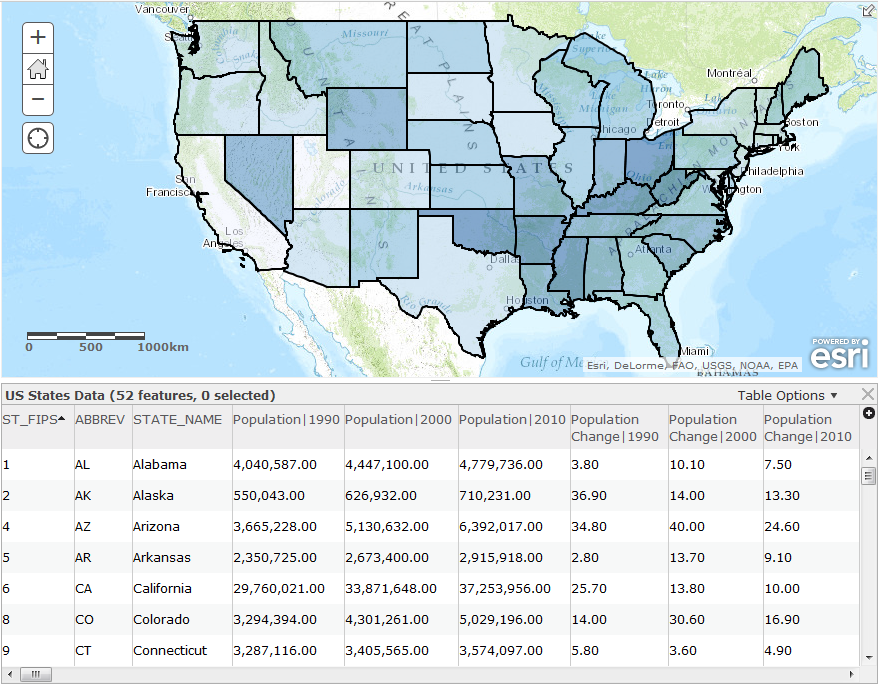
If you are using the data from the feature service, you will need to set up their Field Aliases within the ArcGIS Online web map with this format as these are the names which will be visible in your report.
An example of correctly formatted data for multiple dates in ArcGIS Online is shown below.
If you are using CSV files as your data source, you can pre-define time series data by formatting the column headers using this format. An example of correctly formatted CSV data for multiple dates is shown below:
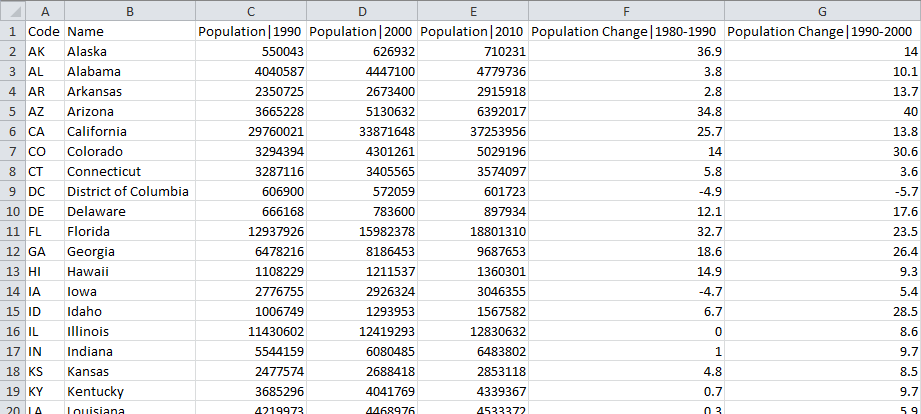
Report Builder will recognize the text before the pipe symbol ‘|’ as the indicator name and the text after the pipe symbol as the time period label.