Report Builder can show confidence limits or error bars in bar charts and line charts. These can either be calculated automatically or, more usefully, populated using an indicator from your report’s data source(s).
Using Indicators as Confidence Limits
To draw a chart with confidence limits you need either two or three related indicators in your data:
- One indicator for the values and one to give the bounds of the confidence limits
- One indicator for the values, one for the lower limit and one for the upper limit
To access the Limits & Error Bars settings in Report Builder, select the widget in the report and ensure that the Advanced button is active in the Settings tab on the right.
The indicators are selected using the Data tab as normal. The setting that controls how they are used in the chart is Limit indicator keys. This is a specially-formatted list that associates indicators with each other to allow the chart to display one or more indicators as a trend line/bar, and others as limits/error bars. There are a number of different options for this setting, all based on this syntax:
&<value-indicator-code-1>=<lower-limit-code-1>,<upper-limit-code-1>&<value-indicator-code-2>=<lower-limit-code-2>,<upper-limit-code-2>
or:
&<value-indicator-code-1>=<calculation-type-1>:<limit-indicator-code-1>&<value-indicator-code-2>=<calculation-type-2>:<limit-indicator-code-2>
where <calculation-type> is one of the following:
P – percentage. The value from the indicator with an ID/code/name of <limit-indicator-code> is treated as a percentage of the actual data value which gives confidence limits of that percentage above and below the data value.
A – absolute. The value from the indicator with an ID/code/name of <limit-indicator-code> is treated as an absolute data value which gives confidence limits of that value above and below the data value.
R – range (or interval). The value from the indicator with an ID/code/name of <limit-indicator-code> is treated as an absolute data range which gives confidence limits of that half (0.5) that value above and below the data value.
For the &<value-indicator-code-1>=<lower-limit-code-1>,<upper-limit-code-1> syntax all values are treated as absolute values.
The example above uses a special form of this syntax:
*=pattern:R:#INAME ~ Confidence
In this form each part has a special value:
* a wildcard – apply the same rule to all indicators in the chart.
pattern:R:#INAME ~ Confidence – means that indicators are not matched on a static ID or name but are looked up based on the pattern supplied. So, for example #INAME is replaced with the name of the first indicator in the chart, Economic activity rate – aged 16-64, and then the limits indicator is found by matching the expanded pattern against the other indicators which matches Economic activity rate – aged 16-64 ~ Confidence.
This type of syntax makes it easy to use many indicators in your chart or to quickly copy-and-paste widgets and substitute new or different data, as long as you consistently use the same patterns when naming indicators. You can use this for upper and lower limits too (but omitting the calculation type, which is presumed to be A, absolute for upper and lower limits), for example:
*=pattern:#INAME lower limit,#INAME upper limit
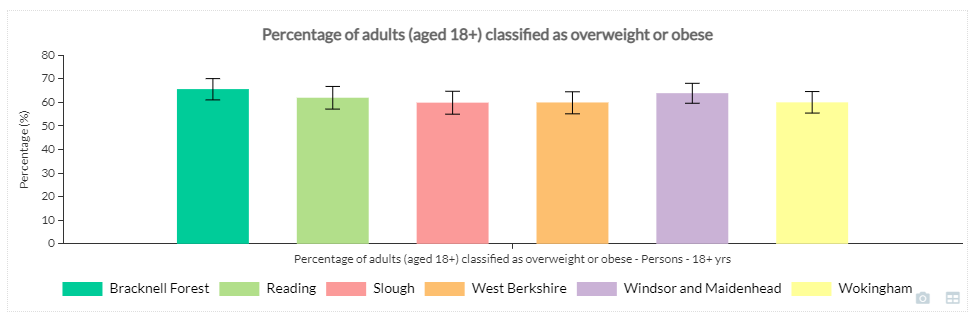
The images below display an example of this syntax using a report with an InstantAtlas Data Catalog as the data source, containing data from the National Data Service.
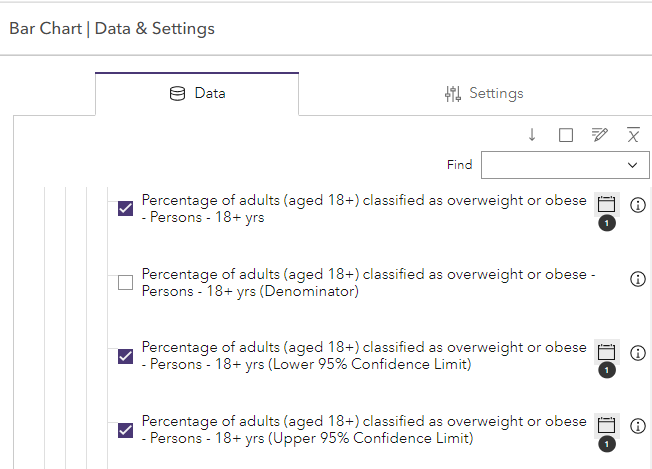
The indicators selected under the Data tab are as shown in the image below. The first indicator provides the values used to draw the chart bars, and the second and third indicators provide the values used to draw the lower and upper confidence limits respectively.
The settings under the Limits & Error Bars heading for this chart were set as shown in the image below.
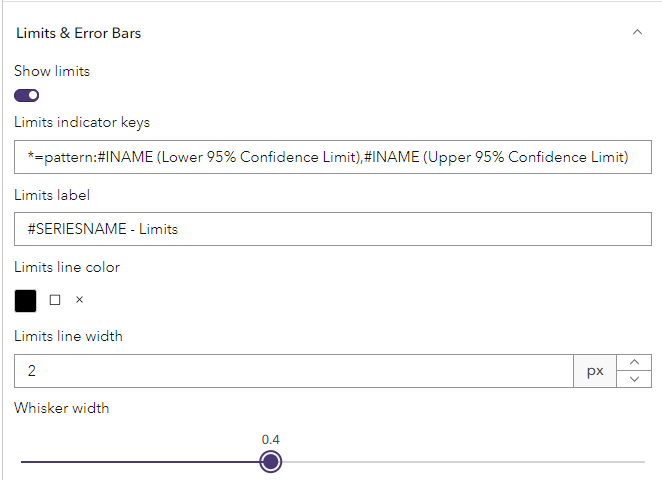
The Limits indicators key is set to the following:
*=pattern:#INAME (Lower 95% Confidence Limit),#INAME (Upper 95% Confidence Limit)
This specifies that the lower and upper limits will be provided by indicators with the same name as the base indicator but with (Lower 95% Confidence Limit) or (Lower 95% Confidence Limit) appended.