Being able to connect to data in a CSV in ArcGIS Online can be very useful. A CSV file is a simple text file that contains the attribute data in a comma-delimited format. The file extension must be .csv. The easiest way to create a CSV file is to use spreadsheet software such as Microsoft Excel to organise your data and then save it as CSV. Please note that only single worksheets can be saved into CSV format.
The structure of the CSV
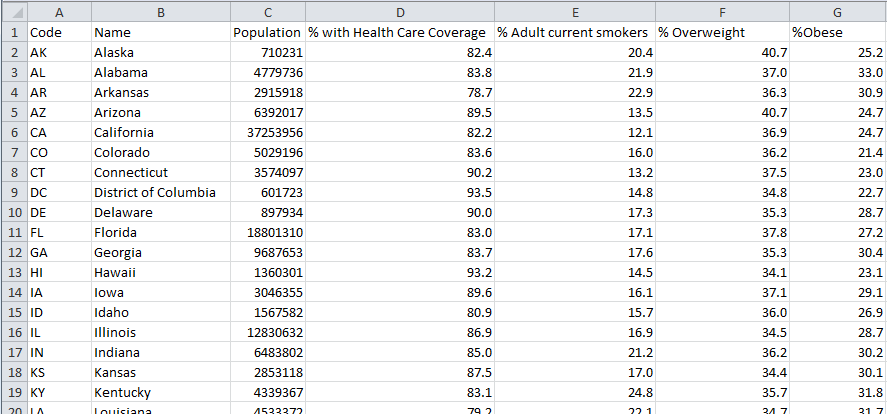
The first row of your CSV contains the column headers. They do not have to be your exact indicator names but you should be able to recognise what they are so that you can use them to build your report. You should avoid using commas in the column headers as this will lead to issues within Report Builder.
Note also that Report Builder requires unique column headers if you are using more than one CSV data source if the columns contain unique data. For example, you cannot have a column called “% Change” in two CSV files if one file means “% change in employment” and the other means “% change in population” as Report Builder will be unable to distinguish them.
You will need a column in your CSV file containing the feature IDs. These must match the IDs of the ArcGIS Online feature service the report is based on. For Report Builder to be able to match the ID fields correctly, the ID column in your CSV file needs to either:
- be named exactly like the ID field of the ArcGIS Online feature service the report is based on or
- be the first column in your CSV file.
![]() Please note: Report Builder no longer allows users to pick the correct ID column from the CSV file as was the case in very old versions of Report Builder.
Please note: Report Builder no longer allows users to pick the correct ID column from the CSV file as was the case in very old versions of Report Builder.
You do not need the feature names in your CSV but it may be good to have them there as a reference for you. The following columns to the right contain the indicators.
Here a simple example:
If the IDs in the first column do not match those that Report Builder is expecting, it will display a warning when the data source is added.
It is possible to include data for any comparison areas you may wish to display in your report. You can also define time series data in your CSV.
If you update the data in a CSV in ArcGIS Online, the updated values of existing indicators will automatically appear in your report. However, you have to ensure that the column headers are named in exactly the same way as in the original CSV.