The latest version of Report Builder (v 1.6.11) is out now!
In this version we have added new date options for non-datastore indicators and made improvements to the infographic widgets. Also we have simplified the process of connecting comparison from different data sources like CSV or table files to the report.
Comparison data from mixed sources
A report can contain data simultaneously from different sources, like a feature service, CSV file or ArcGIS Online Table. Comparison values will now always be taken from the same source as the selected indicator (e.g. a CSV file), if available, and will show as ‘no data’ if undefined.
Date options for non-datastore indicators
Indicators from the data store that have multiple dates can be selected for a time series by either the ‘latest X dates’ option or by choosing which dates to use. This functionality is now also available for feature services used as a data source outside of a data store report.
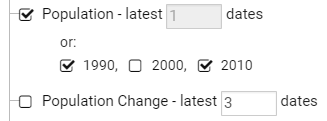
To unlock the date options, the indicator needs to be selected first.
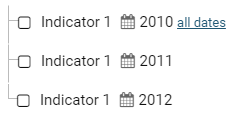
CSV files joined to a report have an ‘all dates’ option instead:
Indicator aliases for Infographics
Widgets of the infographics group, like the scaled or filled icon, are now able to support indicator aliases. To set an alias on an indicator used for the infographic, open the widget properties, data tab and use the right nav bar button to define an alias.
![]()
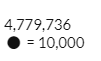
Limit on Repeating Icon widget
The Repeating Icon infographic has now a limit of 1000 icons being displayed, making it safe to use for large indicator values. If the indicator value is larger than 1000, the widget displays the “value” of each icon in the lower left corner.