IA Data Explorer 2.2.0 – 29 Sep 2023 Release Notes

List of changes

Filter modal window

When the Filter button on the Data Explorer home page is clicked, the filter modal window now opens instantly. Prior to this update, this window could take 10 seconds or more to appear.

Data Explorer filter modal window

Decimal places

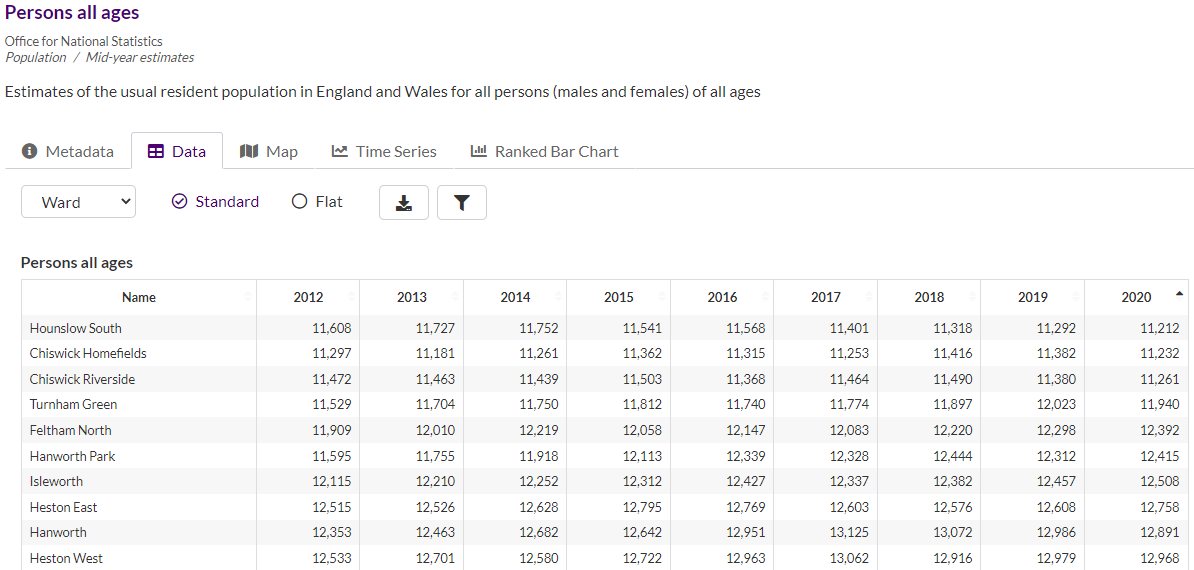
Up until this update, the Data Explorer had no capability to enforce a consistent number of decimal places for numerical data values. In other words, the application would simply display the values stored in the feature service in ArcGIS. An example is shown below – in the 2013 columns there are values displayed with 0, 1 and 2 decimal places (this is how the values appear in the underlying feature service).

Data Explorer data table with inconsistent decimal places

From this update, the Data Explorer will now look for a field with a name of DecimalPlaces in the metadata table for the data catalog. If this is found, the Data Explorer will use the values in this field to set the display decimal places for each indicator. In the example above, if the decimal places field contained a 2 for the Persons age group 0-4% indicator, all data values in the table would be displayed to two decimal places. If there is no decimal places field in the metadata table, the Data Explorer will revert to displaying the values as they are defined in the underlying feature service.

Metadata ordering

Control over the display of metadata in the Data Explorer has been improved. Using the Metadata Fields setting in the application configuration, the owner can control the list of fields that will be displayed in the Data Explorer, irrespective of whether the fields in the metadata table were supplied as standard, or were subsequently added as custom fields. There is now also complete control over the order in which metadata fields are displayed, simply by changing the order in the configuration setting. Again, it is possible to reorder elements irrespective of whether they are standard or custom fields.

Data Explorer metadata tab displaying custom fields

Data export

The data export has been improved so that it now contains custom as well as standard metadata fields. Also, when the Data Explorer is running in the German locale, the CSV export format now opens correctly in Excel (; as delimiter).

German text

Minor changes have been made to the interface text when running the Data Explorer in German.

We hope you will enjoy the new version of Data Explorer!

If you have any questions relating to this release please contact support@instantatlas.com.

IA Data Explorer 2.1.0 – 10 May 2022 Release Notes

List of changes

Ordering of indicators

We have improved the order in which the Data Explorer will display indicators from the National Data Service on initial load and when it is filtered to a theme (with no search term). Prior to this change, indicators in different themes were ending up with an identical score for the purposes of ordering, which resulted in an illogical and confusing list of indicators from different sub-themes. Where an indicator has supporting indicators (e.g. numerator, denominator, confidence intervals), such as much of the health data in the National Data Service, the supporting indicators are now consistently listed immediately below the main indicator to make it easier to read the list. On initial load, the ONS mid-year population estimates appear first, with the total population at the top of the list.

Table sorting

It is now possible to sort the columns ascending/descending in the table view by clicking on a column heading. The sorting state is maintained even if you switch to view data for a different geography.

Mixed data sources

We have made improvements to the way the Data Explorer works with a data catalog that references ArcGIS Enterprise services as well as services in ArcGIS Online, whether these are public or restricted. This is important for customers that host their own data catalog and wish to incorporate data from a mix of sources.

Custom metadata fields

Again, for customers hosting their own data catalog, any custom/extra fields added to the data catalog metadata table will now be displayed in the Data Explorer (in the Metadata view).

Hiding indicators

There is now a configuration option to hide indicators that do not have an entry in the data catalog metadata table. This can be useful to exclude certain indicators that need to be part of the catalog, but do not need to be listed in the Data Explorer.

Bug fixes

  • Unable to backtrack after insufficient rights to view a restricted indicator
  • ArcGIS Online token included in Share link when viewing a restricted indicator

We hope you will enjoy the new version of Data Explorer!

If you have any questions relating to this release please contact support@instantatlas.com.

IA Data Explorer – 10 July 2020 Release Notes

The latest version of InstantAtlas Data Explorer (version 2.0.2) is now available at https://hub.instantatlas.com/.

Version 2.0.2 includes two areas of change.

View ArcGIS Online Item button

If you are signed in to ArcGIS Online (i.e. you sign in via the Data Catalog app or the Data Explorer app is launched with a ?token=xxxxxx argument) you will see a View ArcGIS Online Item button displayed under the Data, Map, Time Series or Ranked Bar Chart tabs.

IA data explorer link to item button

When clicked, the button takes you to the item in ArcGIS Online that contains the data for indicator you are viewing in the data explorer.

This button has been added in order to make it easy to obtain the endpoint of the ArcGIS feature layer containing an indicator from an InstantAtlas data catalog. There are a number of scenarios in which it might be useful to have the endpoint, one being that it enables the use of the data held in the data catalog in other third party systems, such as Microsoft Power BI for example.

Update to sharing/token behaviour

The Data Explorer has been updated so that when it is run in authorised mode (i.e. not shared with everyone) it will pass the token down to all of the feature services it uses. Furthermore, a public-shared Data Explorer will detect whether it needs a sign in for specific feature layers. If the data for the indicator searched for is stored in a feature layer that is protected, the user will be asked to sign in to ArcGIS Online in order to view the indicator in question.

How to embed InstantAtlas apps into your website

The purpose of this post is to provide the necessary information for embedding InstantAtlas apps into a website. Colour is used to explain the code below – if you have difficulty distinguishing the colours used please contact support@instantatlas.com and we will find an alternative. The actual creation of the apps in the first place is not covered in this post.

Data Explorer

InstantAtlas Data explorer apps connect directly to an InstantAtlas Data Catalog in ArcGIS Online and allow your web site users to browse and download data and create graphics for documents and presentations.

Add this code to a web page to embed a data explorer app.


<link href="https://hub.instantatlas.com/data-catalog-explorer/static/css/main.css" rel="stylesheet">
<div id="root"></div>
<script src="https://hub.instantatlas.com/data-catalog-explorer/static/js/main.js"></script>
<script>window.dataCatalogExplorer.launch({ "appid": "e3d83edc76bd45548ddd0e2ee4fe4bdf", "container": "root" })</script>‎

e3d83edc76bd45548ddd0e2ee4fe4bdf – this is the app ID (from ArcGIS Online) of the data explorer app you wish to embed.

An example of embedding a data explorer app can be seen on this page of the Suffolk Observatory.

Map Explorer

Map Explorer apps are simple-to-use apps that that allows a user to select from a pre-defined set of indicators from an InstantAtlas Data Catalog and visualize them as thematic maps.


<div id="ia-map-panel" style="width: 100%; min-height: 500px; height: calc(100vh - 300px);">
<script src="https://hub.instantatlas.com/map-explorer/embed?c=ia-map-panel&appid=917b1891e5934d6baeeff23cdb0e9f38"></script>
</div>

917b1891e5934d6baeeff23cdb0e9f38 – this is the app ID (from ArcGIS Online) of the map explorer app you wish to embed.

Custom Area Reporter

The Custom Area Reporter is an app that allows users to make a custom selection of areas to be viewed in an aggregated or disaggregated form in a report published using Report Builder for ArcGIS. Users select areas from a map using a range of selection tools. Once the areas have been selected, the user can choose from a list of reports – this list is defined in the app configuration.

Add this code to a web page to embed a custom area reporter app.


<link href="https://www.reports.esriuk.com/custom-area-reporter/static/css/car.css" rel="stylesheet">
<div id="car-container" style="width: 100%; height: 500px; border: 1px solid #ccc; position: relative;"></div>
<script src="https://www.reports.esriuk.com/custom-area-reporter/static/js/car.js"></script>
<script defer="defer">window.customAreaReporter.launch({ appid: '1a451d1bbe3544849585ab2745c25f5d', container: 'car-container' });</script>

1a451d1bbe3544849585ab2745c25f5d – this is the app ID (from ArcGIS Online) of the custom area reporter app you wish to embed. The code above contains some styling of the container for the app that you can obviously change if you wish e.g. width, height, border. An example of embedding a custom area reporter app can be seen on this page of the Suffolk Observatory.

Reports

The embedding of reports created using Report Builder for ArcGIS is covered here.

IA Data Explorer – 17 June 2020 Release Notes

The latest version of InstantAtlas Data Explorer (version 2.0.1) is now available at https://hub.instantatlas.com/.

Version 2.0.1 adds powerful new filtering, user interface improvements and bug fixes.

Enhancements

  • New functionality to filter features in the active geography using one or more fields in the feature layer. This allows you to filter to the features contained in a larger area (see example given below)
  • Modal windows now have Apply, Clear and Cancel buttons
  • Search now launches when user clicks a Go button or hits Enter
  • Adjustments to size of modal windows and mobile layout
  • Title and description removed from the list when viewing the Metadata tab (as these are already displayed at the top of the page)

Bug fixes

  • Search not accepting a space in the search term
  • Search launching too quickly when typing a term
  • Filter screen showing incorrect content when the data explorer was set to be filtered to a single root theme in the data catalog (Root Theme ID setting)
  • Modal window display in Internet Explorer 11

New filtering

Setup

A new configuration setting (Field Filters) has been added that allows the owner of the app to supply a comma-delimited list of filter fields that will be displayed in the data explorer.

Display

The list of field filters is displayed when the user clicks the Filter Settings button in the data explorer. If multiple filter fields have been defined, these will be shown in a drop down menu. If only a single filter field has been defined, this will be shown as text. If a field filter contains the same value for all of the features in the active geography, that field will automatically be hidden from the user.

IA Data Explorer field filters

The end user can select a field to filter the features displayed in the active tab. In the Map tab, the map will automatically zoom to the bounding box of the filtered features. The filter is retained when switching between tabs. In the Time Series tab, the Limit Features button/checkbox will automatically disappear if the number of filtered features is less than 10. The user has the option to perform further filtering to select specific features within the field filter by clicking the Features button.

For example, the Map tab is showing Lower Super Output Areas (LSOAs) for Suffolk County.

IA Data Explorer map showing LSOAs

The user can filter to the LSOAs in a particular district, for example Ipswich (District=Ipswich). The map automatically zooms to the filtered features.

IA Data Explorer filtered map

Switching to the Data tab retains the filter and the table (and the data download) will contain only the LSOAs in Ipswich.

IA Data Explorer filtered data tab

Modal windows

The modal windows in the data explorer have gained Apply, Clear and Cancel buttons to make them more user-friendly.

IA Data Explorer modal window

IA Data Explorer – 27 April 2020 Release Notes

The latest version of InstantAtlas Data Explorer (version 2.0.0) is now available at https://hub.instantatlas.com/.

Version 2.0.0 extends the functionality of the data explorer for searching and visualising data in an InstantAtlas data catalog still further by adding powerful charting capabilities and a new redesigned user interface.

Enhancements

  • Improved interface with tabs to switch between metadata, table, map, time series and ranked bar chart
  • New charts to visualize indicator data – time series and distribution/ranking
  • Options to view time series as line, bar or stacked bar chart
  • Improved mapping functionality – within the app rather than as a separate app – version 4 of JavaScript API replaces version 3
  • Full control over which features and dates are displayed in the charts and tables
  • Improved admin/author control over which functionality is available to end users (via ArcGIS Online configure app)
  • Options to view tabular data in “standard” or “flat” format
  • Improvements to download of data

Bug fixes

  • Fixes for bugs when using Internet Explorer 11
  • Fix for commas in area names breaking data downloads
  • Other minor bug fixes

Improved user interface

The data explorer has been updated so that all data visualisation options are integrated within the app. Once an indicator has been selected in the data explorer, a series of tabs provide access to the different views:

  • Metadata: view a description and the full set of metadata for the selected indicator
  • Table: view the selected indicator for all available features and dates, and download as a CSV file
  • Map: view the selected indicator as a thematic map with different classifications available including shaded areas and proportional circles
  • Time Series: view the time series for the selected indicator using a line, bar or stacked bar chart that can be downloaded
  • Ranked Bar Chart: view a bar chart ranking the features for the selected indicator

Controls

Each view can be customised by the end user via a series of controls located at the top of the tab. These controls are hidden by default but can be displayed by clicking the  cog wheel icon.

  • Select geography menu: use this menu to select from the list of available geographies
  • Select dates: use these menus to select the range of dates you would like to view data for
  • Filter features: use this button to access the list of features belonging to the active geography and use the checkboxes to make your selection. Click X to apply the selection.
  • Table format: choose between Standard and Flat formats for the data
  • Download: download the data as a CSV file that can be opened in another package such as MS Excel for further analysis.

Table

The table by default will show data for all dates available for the selected indicator, for all of the features in the active geography. The end-user can filter the features and change the date range using the controls above the table. The table can be scrolled if there are too many features/dates to show on the screen. The download button will download the table as a CSV file; only the data showing in the table when the button is clicked will be downloaded.

IA Data Explorer Data tab

Map

The map will show data for a single date for the selected indicator, for all of the features in the active geography. The end user can change the geography, select a different available date for the indicator and change the map classification. The map is interactive and can be dragged and zoomed. There are a number of options available from the map area:

  • Home: return to the default map extent
  • Export: export the map as an image or a PDF – there are various options to change the layout, or add a title and other text
  • Basemap: change the basemap for the thematic map
  • Search: type in the search box to search for a feature in the active geography or a place in the map area

IA Data Explorer Map tab

Time Series

The chart will by default show data for all dates for the selected indicator, for up to 10 features in the active geography. The end user can change the date range and filter the features using the controls above the table. They may also click the checkbox to remove the 10 feature limit, although this may create a messy chart depending on the number of features in the active geography. There is a menu to change the type of chart:

  • Line: a separate line is shown for each feature
  • Bar: a separate bar is shown for each feature
  • Stacked bar: one bar is shown for each date and features are stacked

IA Data Explorer Time Series tab - line chart
IA Data Explorer Time Series tab - bar chart
IA Data Explorer Time Series tab - stacked bar chart

Ranked Bar Chart

The ranked bar chart shows the data for a single date for the selected indicator, with a bar for each feature in the active geography. The end user can change the selected geography, date, filter the features or download the chart as an image.

IA Data Explorer Ranked Bar Chart tab

Metadata

The metadata tab displays the description and the full set of metadata for the selected indicator. This can be download as a CSV file using the download button.

IA Data Explorer Metadata tab