
The latest version of Report Builder (v 1.6.8) is out now!
In this version we are introducing thematic maps and confidence limits for charts. Also we have simplified the process of connecting data sources like csv or table files to the report.
Connecting data sources
We have relaxed the requirements on connecting data sets from sources like tables, csv files or layers. Until now, the first column of the data was required to contain codes that match the area codes of the report. Now these codes can come from any column in the data set. If Report Builder doesn’t find codes in the first column, it will prompt the user to manually select a column:
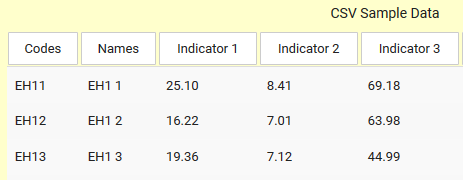
Click on the header of the column you would like to use. Codes still need to be unique and need to match the area codes in order to connect the data successfully.
Thematic Maps
The web map widget now has a Quick Pick for thematic maps.
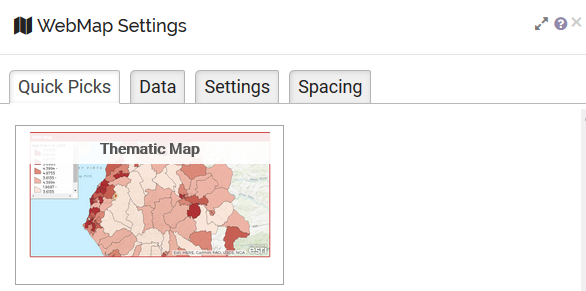
Use this Quick Pick in combination with a single indicator from the data store (‘Data’) to generate a thematic map for your area. Further settings can be found in the advanced options of the ‘Map’ group (‘Settings’).
Limits / Error bars for charts
Report Builder can show confidence limits (or error bars) in bar charts and line charts. These can either be calculated automatically or populated using an indicator from your report’s data source(s).
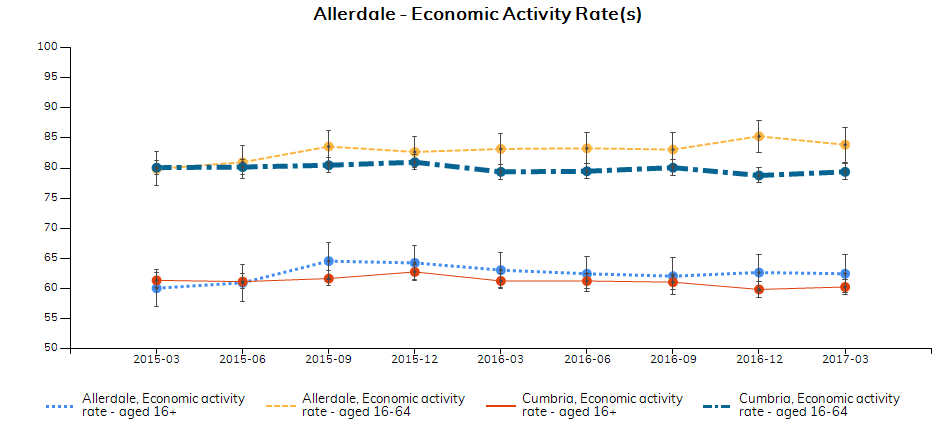
Please find more information about this widget in this support article.