
Contents
Overview
You may have just taken out a trial of the Data Catalog app in the ArcGIS Marketplace and are wondering what this app is all about. Alternatively, you or the administrator of your organisational ArcGIS Online account may have purchased a subscription of the Data Catalog app and you are now wondering where to start. This tutorial will give you an overview of the purpose and main features of the Data Catalog.
The Data Catalog app in the ArcGIS Marketplace actually gives you access to four related apps that can be accessed through the InstantAtlas Data Catalog | Hub. These are (click on each item to see a short description):
Creating a new data catalog with population data
To use each of these apps you will need a valid InstantAtlas data catalog in your ArcGIS Online account. Assuming you are new to the Data Catalog app, it is likely that you don’t have an InstantAtlas data catalog yet. The homepage of the Hub will detect this and display a welcome text together with a big orange button labelled Add New Data Catalog at the top right-hand side.
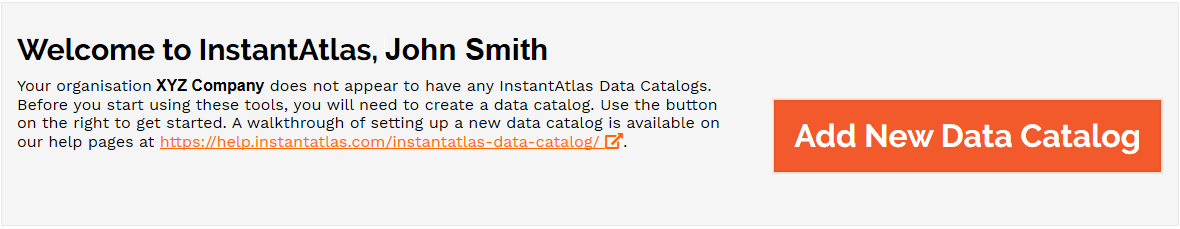
Click this button and you will be directed to the Add New Catalog page.
![]() If your organisation already has an InstantAtlas data catalog, you won’t see the welcome text and the orange Add New Data Catalog button. If you still wish to follow this tutorial to get familiar with the Data Catalog apps, you can force the creation of a new catalog by clicking on Manage Catalog in the hub homepage and then changing the URL in your browser from
If your organisation already has an InstantAtlas data catalog, you won’t see the welcome text and the orange Add New Data Catalog button. If you still wish to follow this tutorial to get familiar with the Data Catalog apps, you can force the creation of a new catalog by clicking on Manage Catalog in the hub homepage and then changing the URL in your browser from /manager?item=<itemid> to /manager?catalog=new.
On the Add New Catalog page, enter a suitable name for your new data catalog and select the folder you want it to be saved in. Then, under Data, select Example population data – USA. Now click on the button Add New Data Catalog.
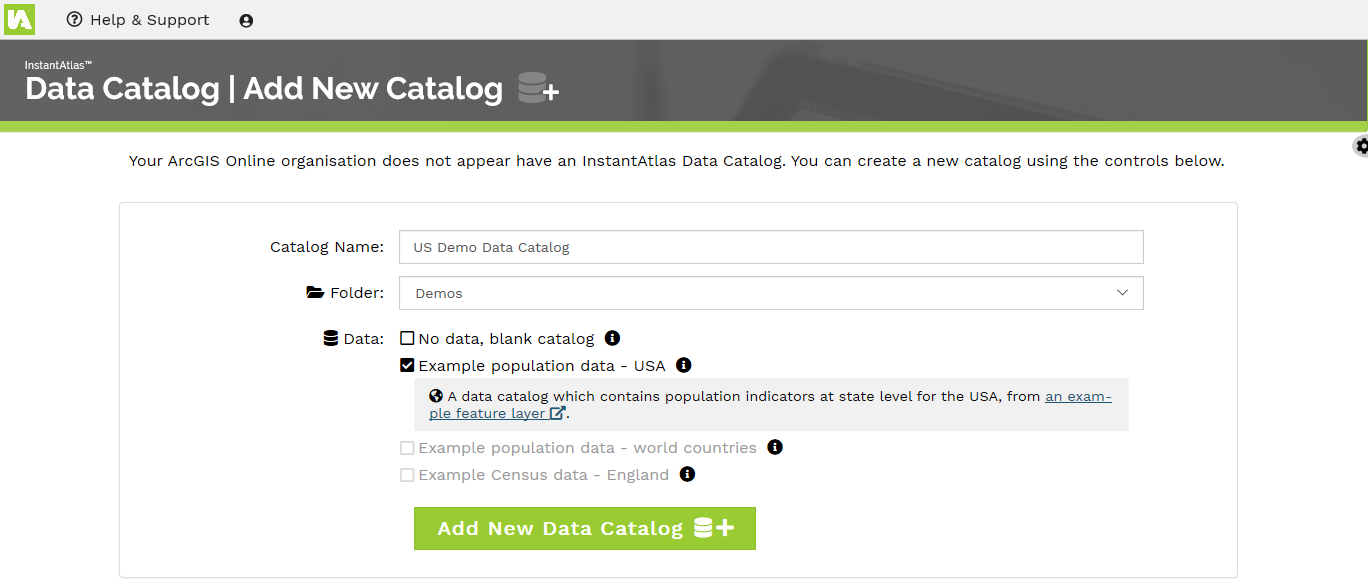
The new data catalog is created in the specified folder and a bar will indicate progress. Once finished, the Data Catalog|Manager will open showing the content of the data catalog.
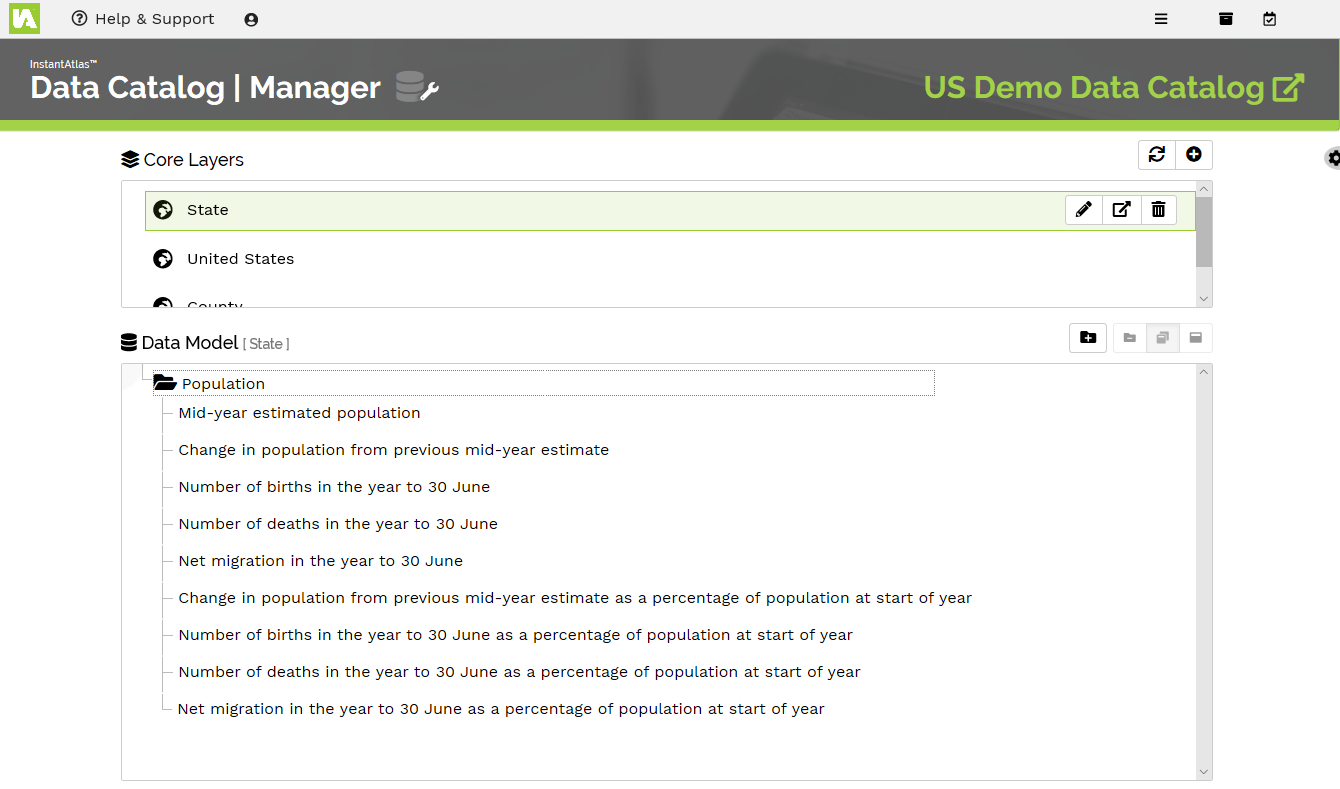
At the top of the screen you will see a list of Core Layers. A core layer is a feature layer that represents the geographical features for which data is to be viewed. In this example dataset, there are three core layers: County, State and United States.
Below the core layers you will see the Data Model for the selected core layer. A data model consists of themes, sub-themes and indicators in a tree structure.
Before editing the data model in the Data Catalog Manager, you may want to have a look at your ArcGIS Online content, particularly the folder you specified when creating the new data catalog. You will see two new hosted tables together with their relating file geodatabases.
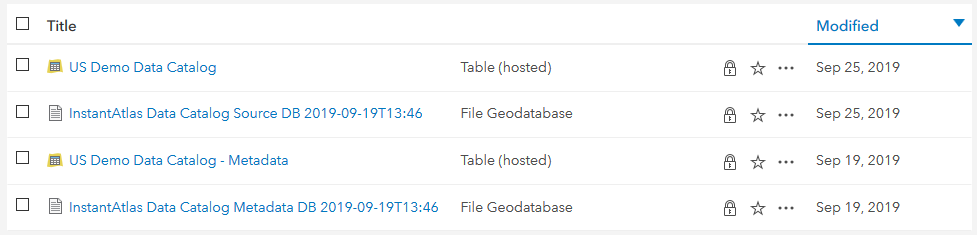
The table with the same name as your new data catalog is called the master table. Open the item’s details page and click on Data in the blue menu (top left-hand side). This table contains the definition of the core layers and data model with its themes, indicators and instances. If you scroll to the right you will find the Service_URL field containing the references to the relevant feature services.
The second new table in your folder contains the metadata for the indicators / instances in the data catalog.
Creating sub-themes and moving indicators
Back in the Data Catalog Manager, explore the data model of the US example population data catalog. Initially it only contains one theme called Population and a number of indicators within this theme (click on the folder name to expand its contents).
Different core layers can contain different indicators; however, the theme structure is the same across all core layers and hence only needs to be defined for one of them. Let’s create two sub-themes within the Population theme and move the existing indicators into the two new themes.
To create a sub-theme, select the parent theme (in this example Population) and click on the Add Theme button. A new folder will appear within the Population folder called New Theme <yyyy-mm-dd hh:ss>, where <yyyy-mm-dd hh:ss> is being replaced by the date and time stamp of the theme creation.
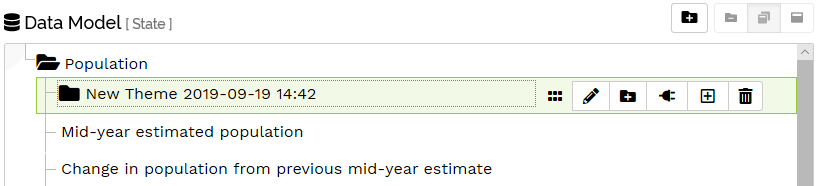
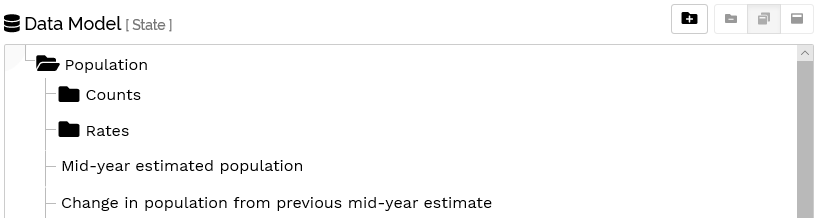
To rename the theme, select it, so that it is highlighted and click on the button and enter Counts as the new theme name. Select the button to submit the changes. In the same way create a second sub-theme within the Population theme called Rates.
Next you will move the indicators that contain the word ‘percentage’ in the indicator name into the Rates sub-theme. The other indicators are to be moved into the Counts sub-theme. To move an indicator, select it and use the button to drag and drop the indicator into the respective sub-theme folder. A green plus icon needs to appear to the left of the folder you wish to move the indicator into before you release your mouse button. The data model will refresh after every move to show the changes.
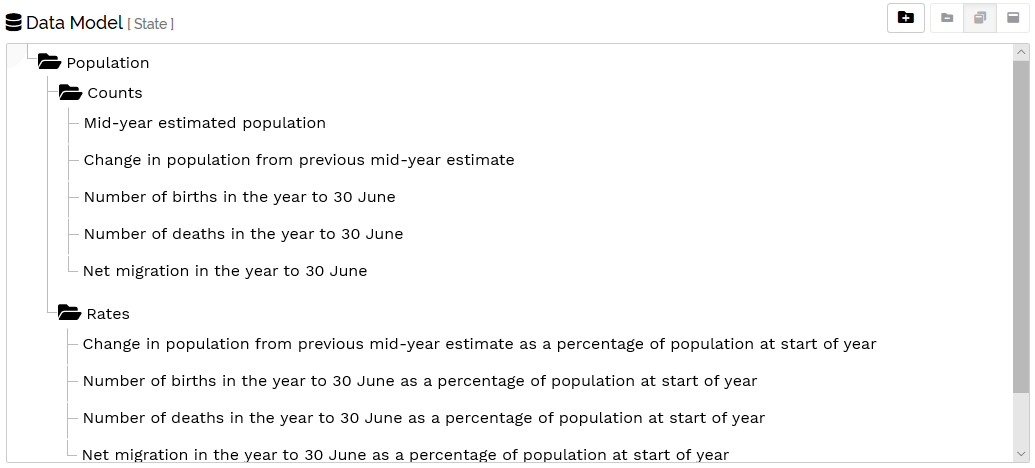
If you have moved the indicators whilst having either the State or the United States core layer active you should now select the County core layer. You will find additional indicators in the County core layer that do not exist in the other two. Move these indicators into their respective sub-themes as well.
You may have noticed that when you make a change to an indicator (e.g. its position but it applies to the name as well) this is reflected no matter which core layer is selected above.
Adding income indicators from a second feature service
Currently the data catalog only contains data from one single feature service. One of the benefits of the Data Catalog Manager is that it is possible to manage and organise data from multiple different feature services that might be saved in different ArcGIS Online accounts. To demonstrate this, let’s assume you have some income related indicators in a second feature service and you wish to add them to your data model.
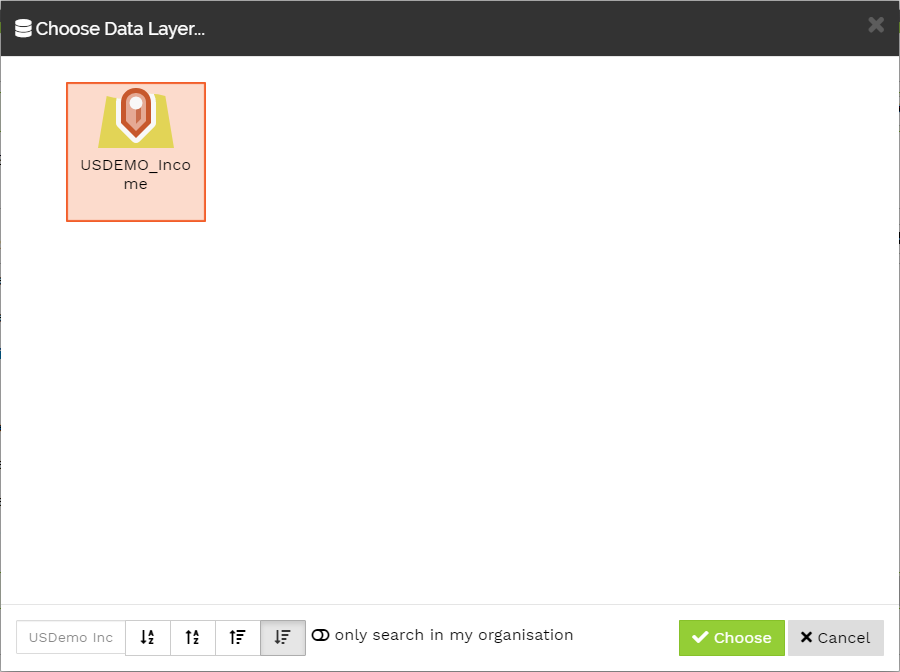
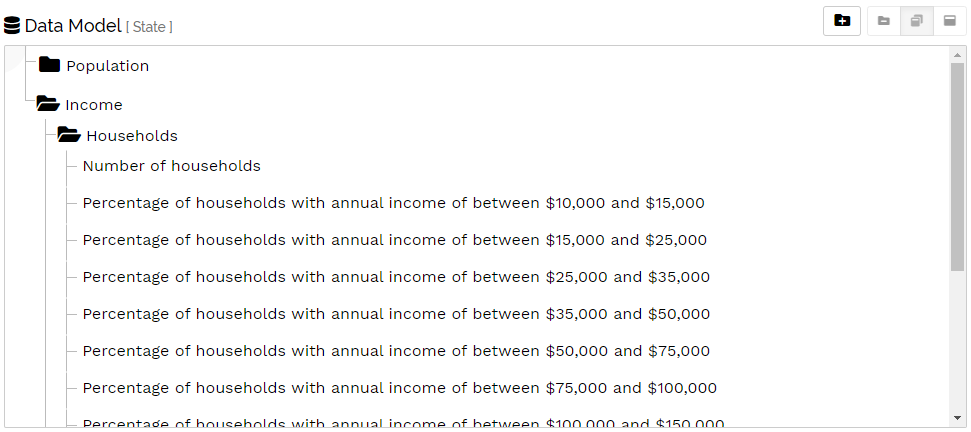
As a first step, create a new root theme by clicking on the Add Theme button at the top right-hand side of the data model. Rename this theme to Income and create two sub-themes, one called Households and the other called Families. With the Households theme selected, click on the Add Indicator Connection button. At the bottom of the Choose Data Layer… dialog switch the option only search in my organisation off. In the search field at the bottom left hand side type USDemo Income. Select the Feature Service called USDEMO_Income and click Choose.
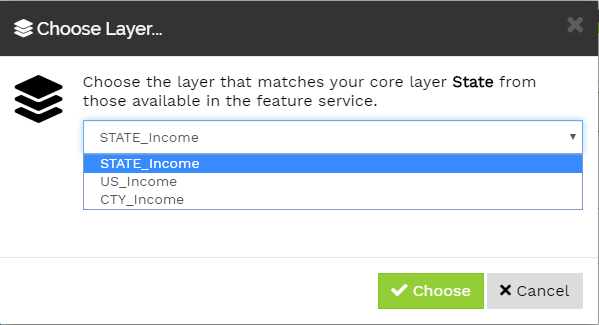
In the Choose Layer… dialog that opens, select the layer from the drop-down list that corresponds to the active core layer in your data catalog. For example if you have the core layer State active you should pick STATE_Income from the drop-down list. Then click the Choose button.
In the Choose Indicators & Dates dialog, untick the checkbox of all indicators that are not related to households. Leave all date checkboxes ticked. Then click the Save button.

As a result, you will see all household income related indicators listed in the Households sub-theme within the Income theme.
You can check if the references to the data fields from the feature service were generated successfully by selecting one of the indicators and clicking the Dates button. The dialog that opens shows all dates for that indicator together with their field names from the feature service. You can also find the link to the feature service at the top of the dialog.

![]() Please note that the data catalog stores only references to the feature services holding the data – the data values themselves are not imported into the master table.
Please note that the data catalog stores only references to the feature services holding the data – the data values themselves are not imported into the master table.
Similar to adding the household income indicators, you should now add the indicators related to family income into the Families sub-theme.
Adding indicators has to be done for each core layer separately, so you may want to add the available income indicators into the relevant theme for the other two core layers.
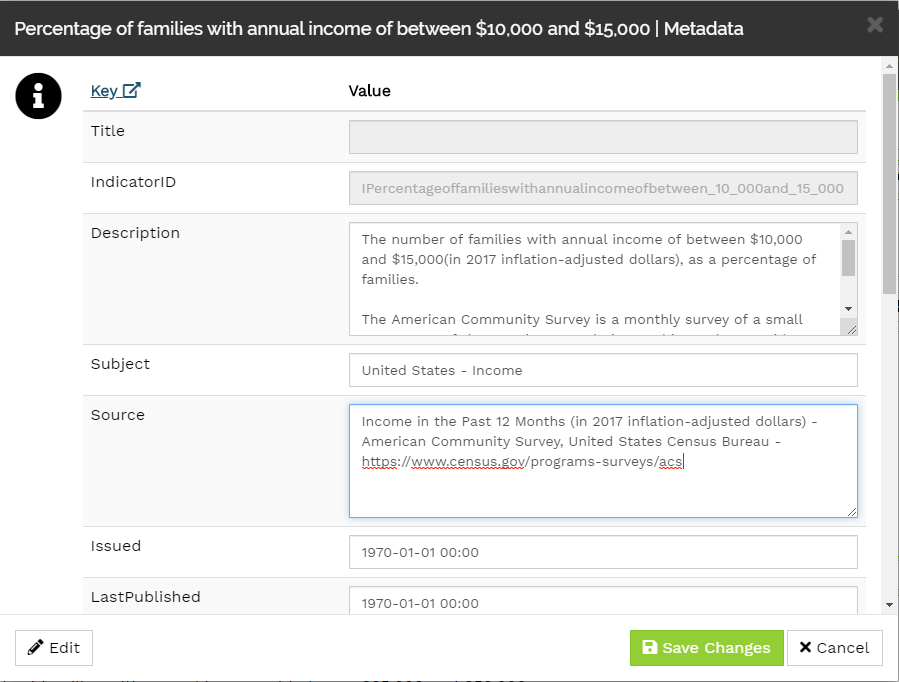
If you wish to add metadata for your new indicators, this can be done by clicking on the button of a particular indicator. You will see the list of available metadata items with the IndicatorID already filled in. Click on the Edit button at the bottom left-hand side to enter metadata information. The Title will be added as soon as you click on the Save Changes button (Title and IndicatorID cannot be changed via this dialog).
If you have a large number of indicators, adding metadata through the Data Catalog Manager interface may not be the most efficient method. As an alternative, you can create a CSV file containing the metadata for your new indicators and append it to your metadata table within ArcGIS Online.
Checking the data catalog using the Inspector
Once you have added all indicators for all core layers to the data catalog, you can now use the Data Catalog|Inspector to check that the data catalog is valid.
There are two ways to access the inspector: You can return to the Hub homepage by clicking the ![]() logo at the top left-hand corner of the screen and then select Inspect Catalog. Alternatively, click on the cogwheel icon on the right-hand side of the page. This opens a wheel from where the other apps – including the Inspector – can be accessed.
logo at the top left-hand corner of the screen and then select Inspect Catalog. Alternatively, click on the cogwheel icon on the right-hand side of the page. This opens a wheel from where the other apps – including the Inspector – can be accessed.
The Inspector allows you to check the integrity of your data catalog. You can choose which items (core layers, themes, indicators, instances and relationships) of the data catalog to include in the inspection. Once you made your selection, click the green Check button. Messages will be displayed in the box below.
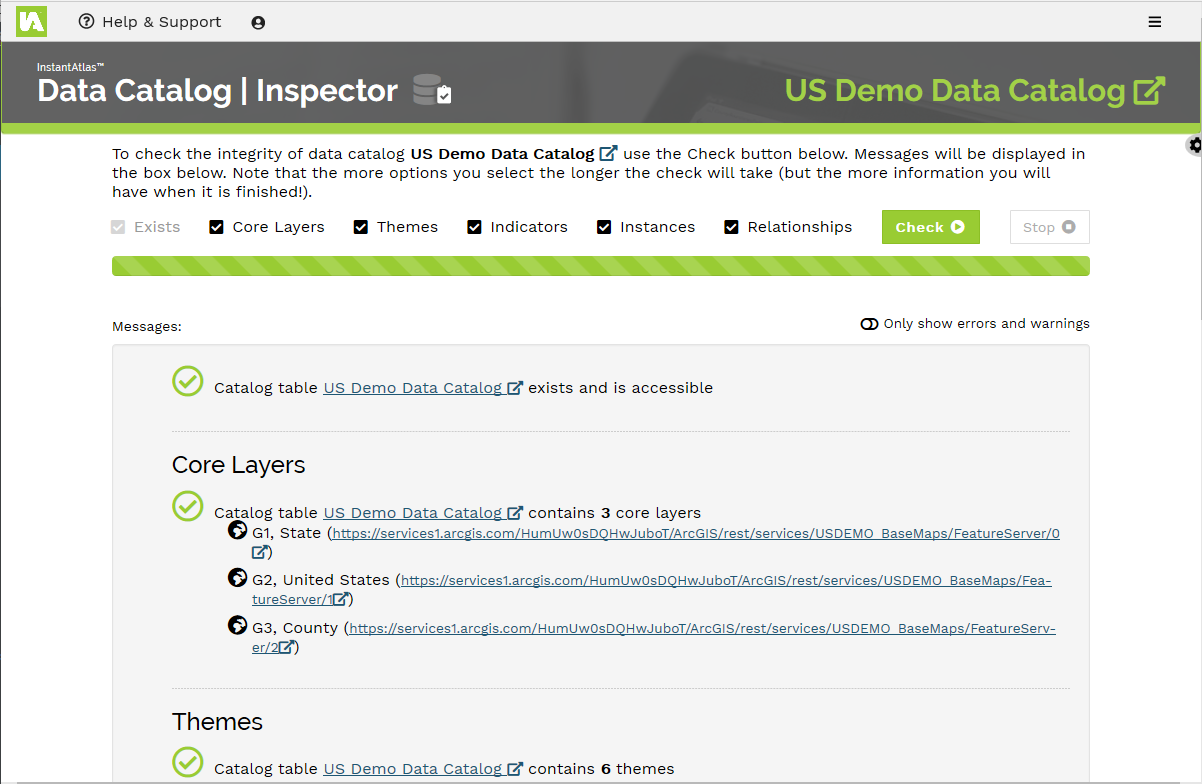
A green circled tick indicates that no issues were found with this element. If you see warnings and/or errors these should be attended to as they could have an impact on your data showing correctly in a web map or an InstantAtlas report. If you need assistance in solving any issues, please get in touch with support@instantatlas.com.
Browsing the data using the Explorer
There are two ways to access the Explorer: You can return to the Hub homepage by clicking the ![]() logo at the top left-hand corner of the screen and then select Explore Catalog. Alternatively, click on the cogwheel icon on the right-hand side of the page. This opens a wheel from where the other apps – including the Explorer – can be accessed.
logo at the top left-hand corner of the screen and then select Explore Catalog. Alternatively, click on the cogwheel icon on the right-hand side of the page. This opens a wheel from where the other apps – including the Explorer – can be accessed.
The explorer allows you to search for a particular indicator using the search field and/or filter the list of indicators by theme/geography/publisher.
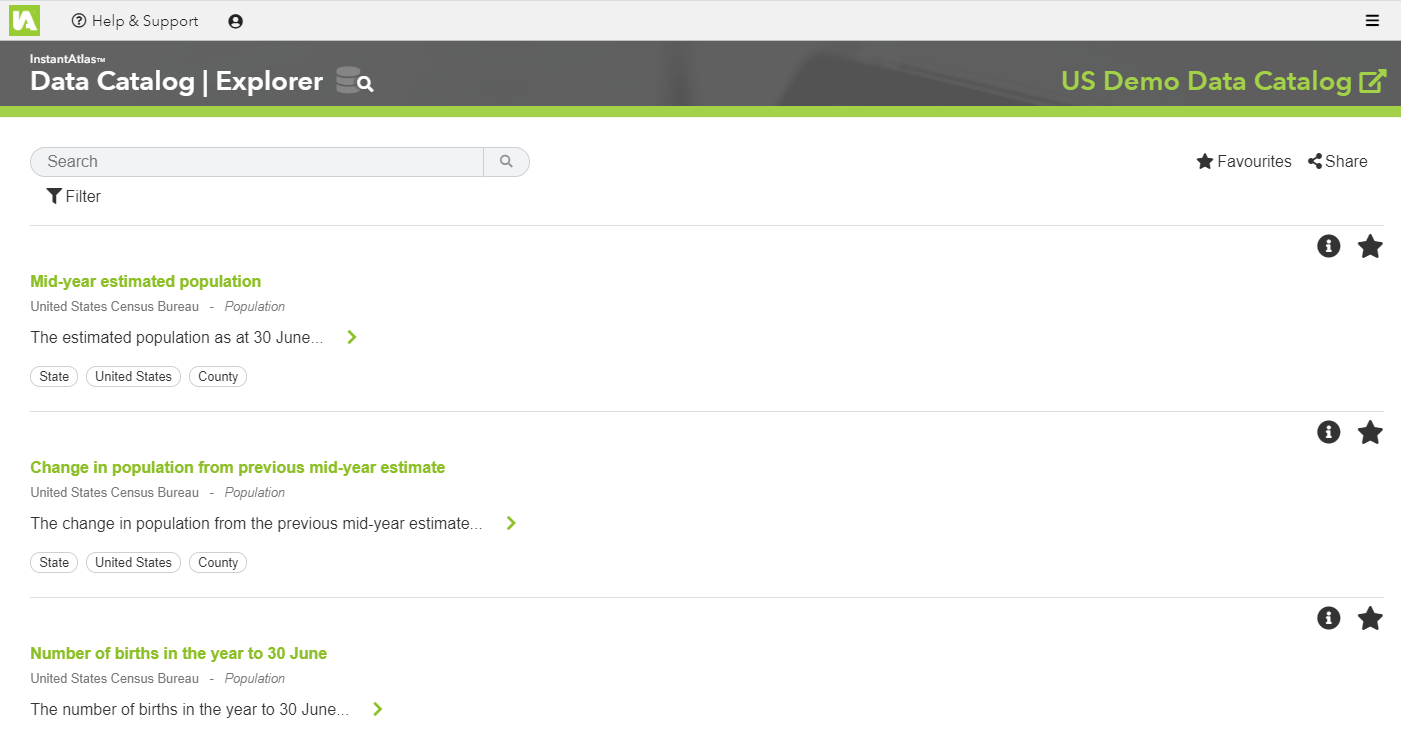
Click on an indicator and then use the tabs to view metadata or view the data in a table, map or chart. There is the option to download the data (CSV) from the Table tab.
Creating a web map using the Web Map Builder
The Web Map Builder allows you to quickly create a web map using one or more of the indicators in your data catalog.
There are two ways to access the Web Map Builder: You can return to the Hub homepage by clicking the ![]() logo at the top left-hand corner of the screen and then select Build a Web Map. Alternatively, click on the cogwheel icon at the right border of the page. This opens a wheel from where the other apps – including the Web Map Builder – can be accessed.
logo at the top left-hand corner of the screen and then select Build a Web Map. Alternatively, click on the cogwheel icon at the right border of the page. This opens a wheel from where the other apps – including the Web Map Builder – can be accessed.
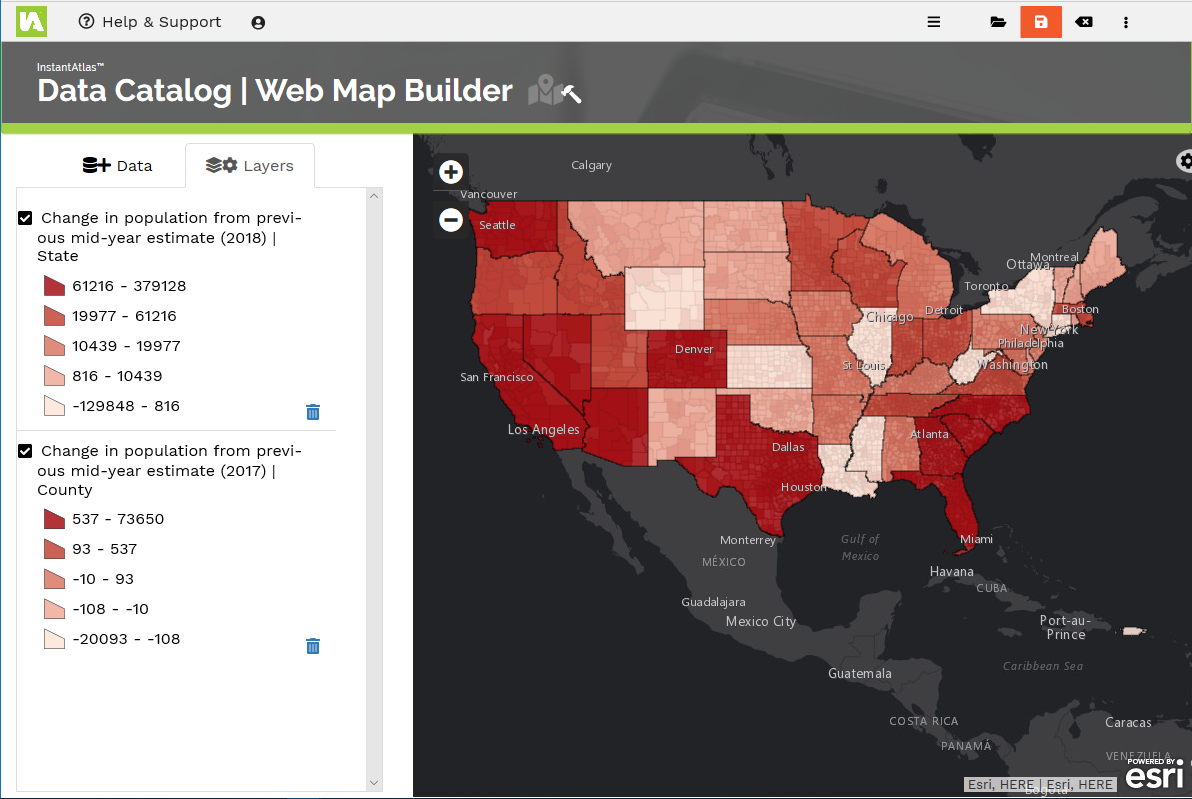
On the left-hand side, you can see the data model of your data catalog in the Data tab. Expand the themes to see the indicators. At the bottom you can change the active core layer. You can add an indicator to the map on the right by clicking on one of the plus icons. The icon adds the selected indicator for the active core layer whilst the icon adds the indicator for all available layers. After you have added one or more indicators, switch to the Layers tab where you can review your selection and if necessary remove layers again.
Once you are happy with your selection click the orange button to save your web map. More information is available on the Web Map Builder help page.
![]() Please note that the Web Map Builder allows you to create a quick starting point for a web map. Its purpose is not to replicate all of the functionality of the ArcGIS Online Map Viewer so for any further changes to the appearance and functionality of your web map you should continue editing it in ArcGIS Online.
Please note that the Web Map Builder allows you to create a quick starting point for a web map. Its purpose is not to replicate all of the functionality of the ArcGIS Online Map Viewer so for any further changes to the appearance and functionality of your web map you should continue editing it in ArcGIS Online.
What’s next?
Congratulations, you have now completed this introduction tutorial. As a next step we recommend that you have a look at the Data Catalog help pages. You will need to read these carefully if you wish to add further data to your catalog, in order to understand the rules and requirements for the feature services containing the data. If you have any questions that have not been answered yet or if you get stuck in creating your own data catalog, please feel free to contact support@instantatlas.com.