The required data structure is represented below, and an example workbook containing fictitious election results has been included in the ‘iadatasheet’ worksheet of the workbook named IAworkbookElectionResults.xls. This file is found in the ‘workbooks’ subfolder of your installation folder of InstantAtlas.
The data in the iadatasheet of the example workbook provided is divided into two themes containing a number of indicators and associates. These are discussed below in detail, in reference to the example workbook, to help you create your own election results workbook.
Theme 1
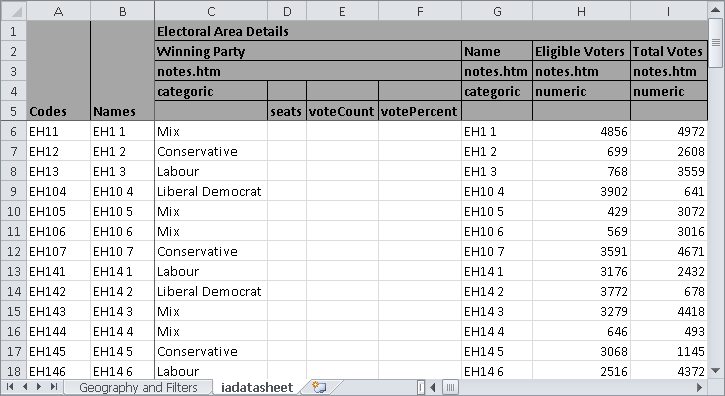
theme (row 1, merged across Column C to K) contains a number of indicators that contain all data except for the breakdown of election results. It is named ‘Electoral Area Details’ in the example workbook, as shown below.
Theme 1, Indicator 1
This indicator (row 2, merged across Column C to F) contains data populating three areas of the report: the ‘Winning Party’ shown in the first theme of the Spine Chart; the winning parties shown in the Table below the Map; and all of the Comparison Table at the top-right of the report. This indicator is named ‘Winning Party’ in the example workbook.
The indicator type is designated ‘categoric’ in cell C4, and associates are assigned in cell D5 as ‘seats’, in cell E5 as ‘voteCount’, and in cell F5 as ‘votePercent’.
For the ‘Winning Party’ and ‘Name’ lines of the first theme of the Spine Chart and all of the data shown in the Table below the Map, displayed values are taken from text entered in Column C. Note that no associate values are displayed for those two areas.
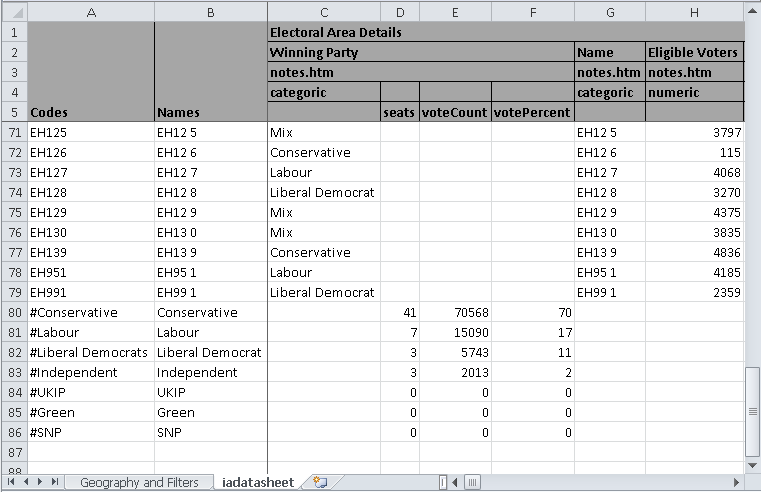
The Comparison Table data is set up slightly differently. Comparison data codes are entered in Column A but preceded with hash symbols, as shown in cells A80-A86 in the screen shot above. Enter each party name as it will appear in the Comparison Table of the report in Column B, next to its code. Note that no indicator value is given in column C. Instead, the data for the Comparison Table is taken from the associate columns (D to F). Accordingly, the total won seats are given as values in column D, the numbers of votes are given in column E, and the percentages of votes won are given in column F.
Theme 1, Indicators 2-6
Cells G2, H2, I2, J2, and K2 contain indicators 2-6 of Theme 1. These indicators have been assigned as ‘Name’, ‘Eligible Voters’, ‘Total Votes’, ‘Turnout %’, and ‘Seats’ in the example workbook. This data is displayed in the first theme of the Spine Chart.
Theme 2
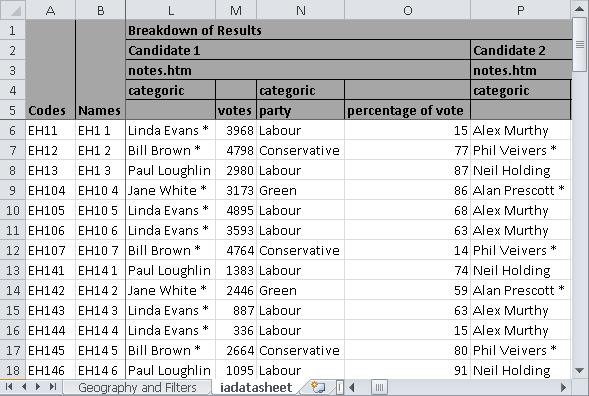
The second theme is the breakdown of an election. This theme provides the data shown in the second theme of the Spine Chart.
The indicator type is categoric and the value is the name of a candidate. The number of indicators in this theme depends on the maximum number of candidates that stood for an election in the area(s) displayed in the Map. Stars have been added to winning candidates’ names and associate values for ‘Votes’, ‘Party’ and ‘Percentage of Vote’ have been included, as shown below.