Adding a map to your reports can provide some much needed context for your readers, and also display your data in an informative and engaging style. While a lot of the Report Builder widgets will likely be intuitive for the avid ArcGIS Online user, there are some widgets you may not be familiar with.
The map widget allows you to display a map of the report base layer either as a simple map of the areas available to report on, or as a thematic map, focused on a particular indicator. Alternatively, this widget also allows you to display any other web map you have available within ArcGIS Online.
Within this blog, I will walk you through an example use case of the Web Map widget, to help you get started with your own report. I will be using the new 2021 Census Population Summary data, filtered down by region.
Let’s get started:
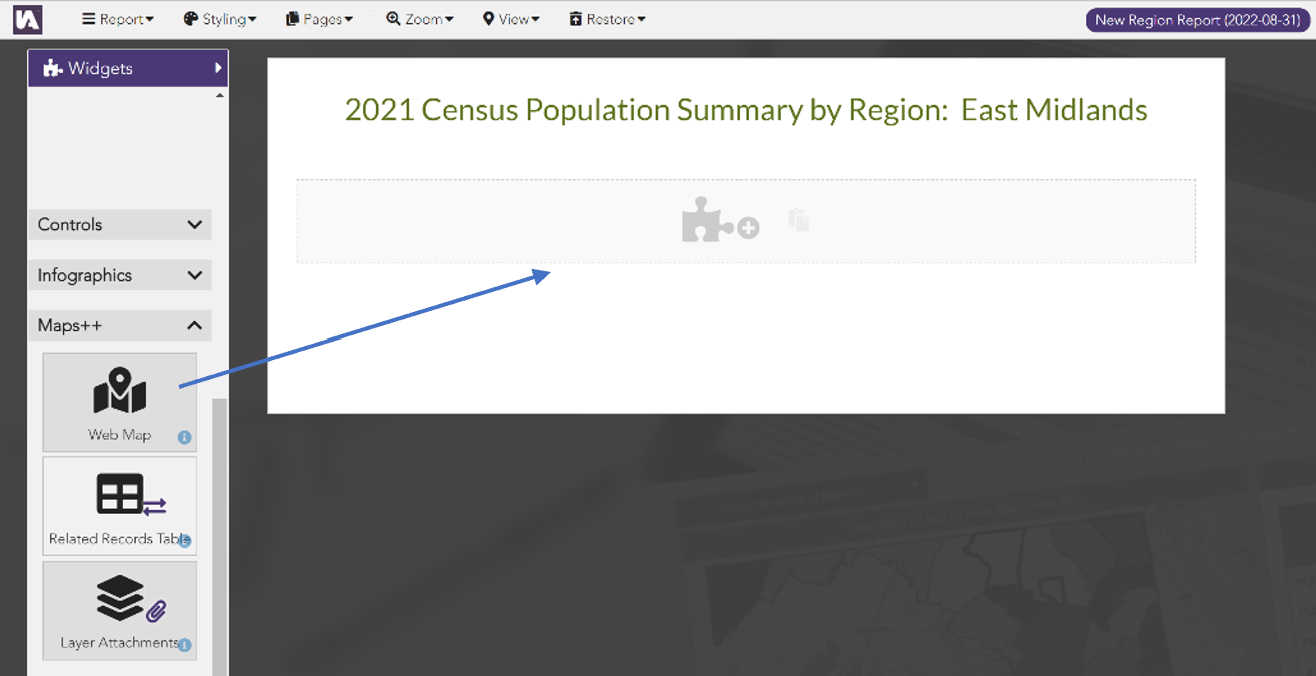
1. Drag the Web Map widget into your chosen position on your report, bearing in mind that this position can be changed at any time.
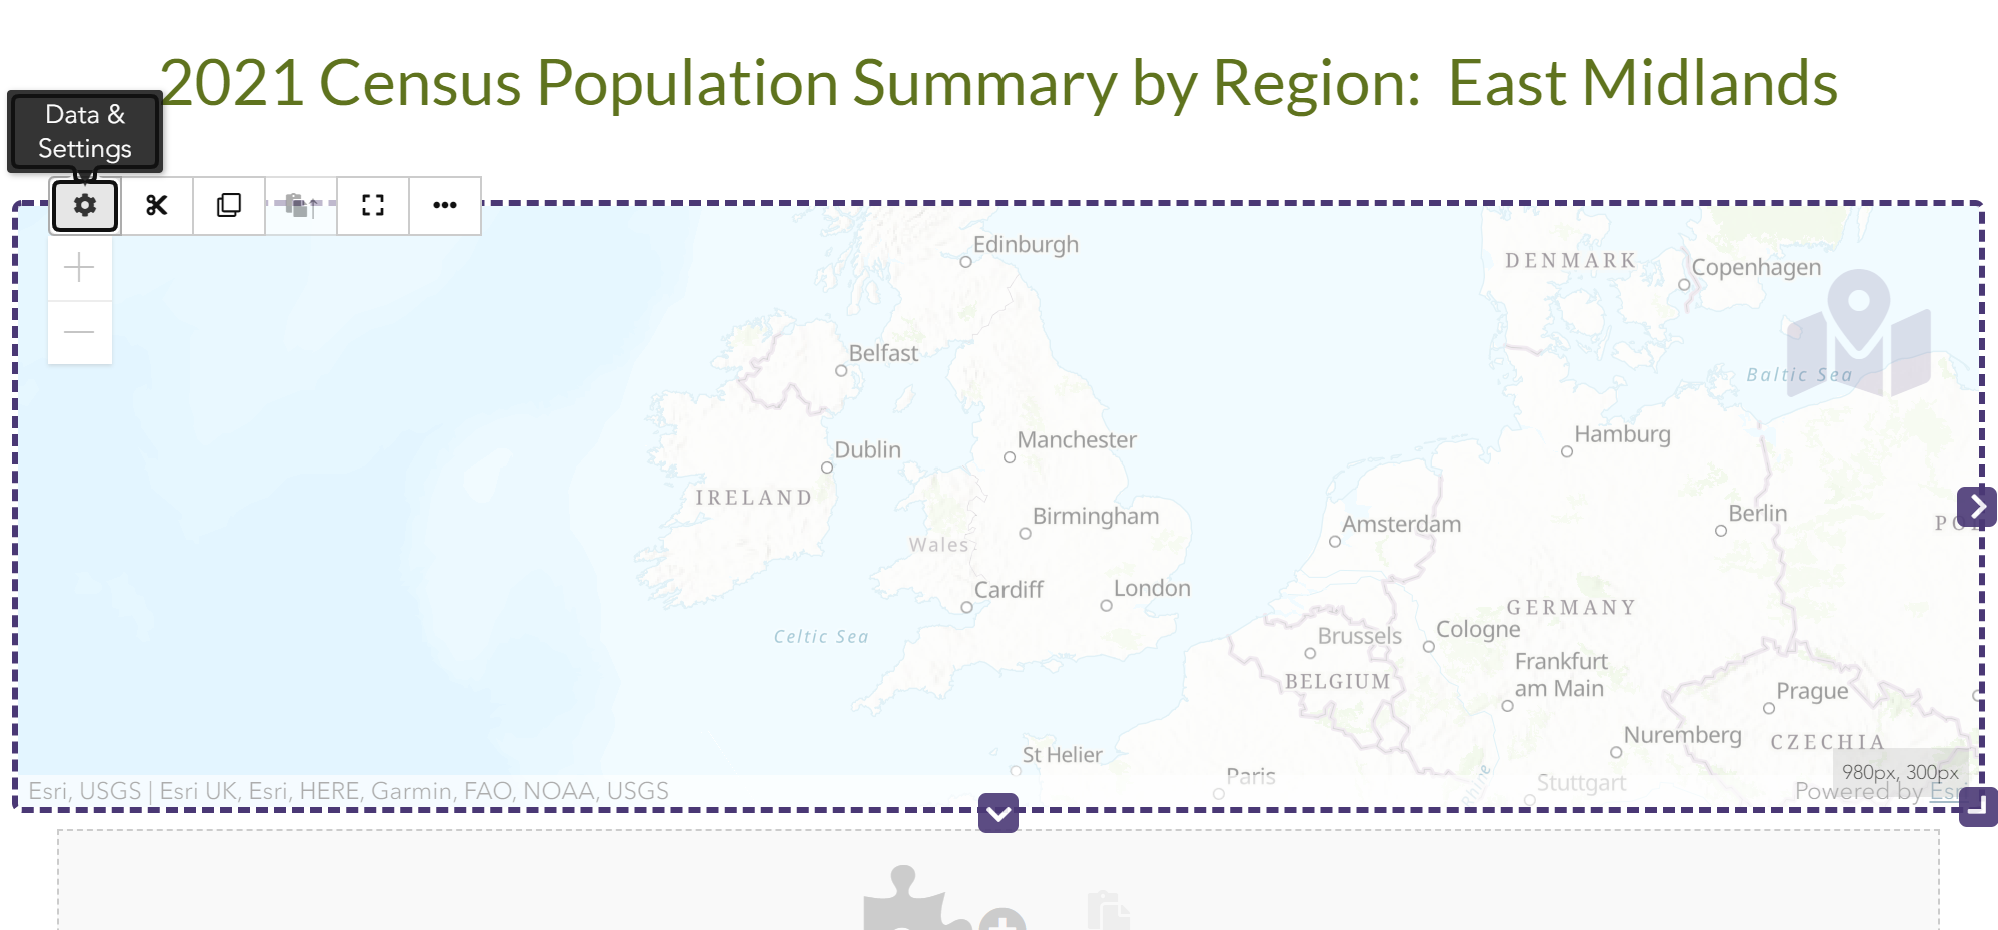
2. Now we’ve added our web map widget, we can begin editing. To start, click on the centre of the web map and select “Data & Settings”. This will bring up a new window with everything we need to redesign our map.
Please note: I am working with the “advanced settings and controls” toggled on, which can be found in the bottom left hand corner of the Data and Setting’s screen. This provides some more options for designing your map, and is by no means necessary for creating your map. Although, if you would like to enable Thematic mapping (which I will go through later), you will need this option toggled on.
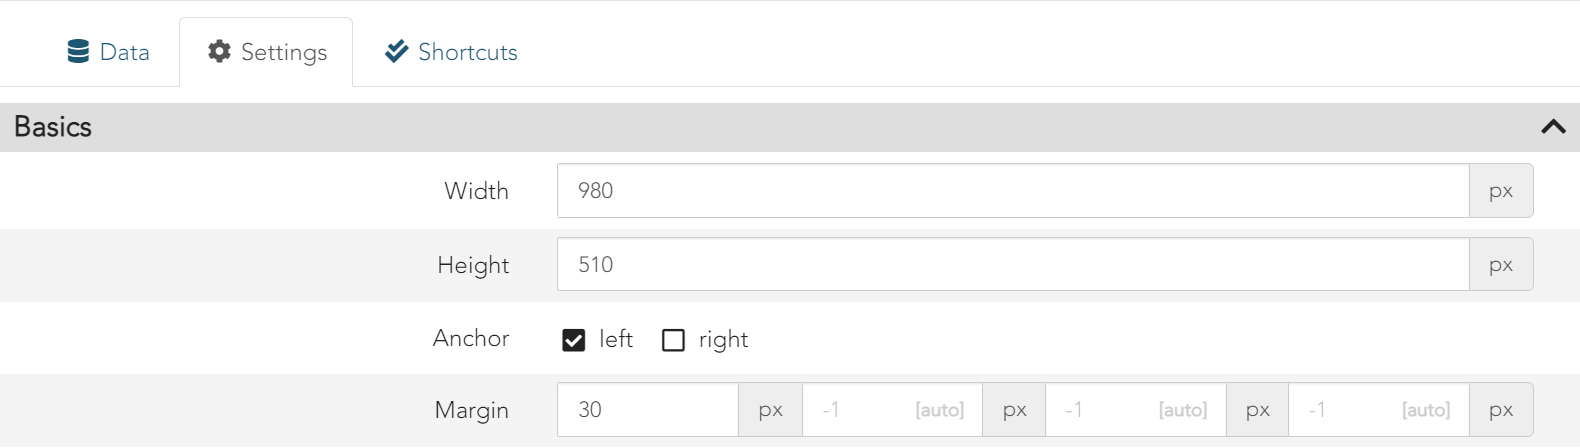
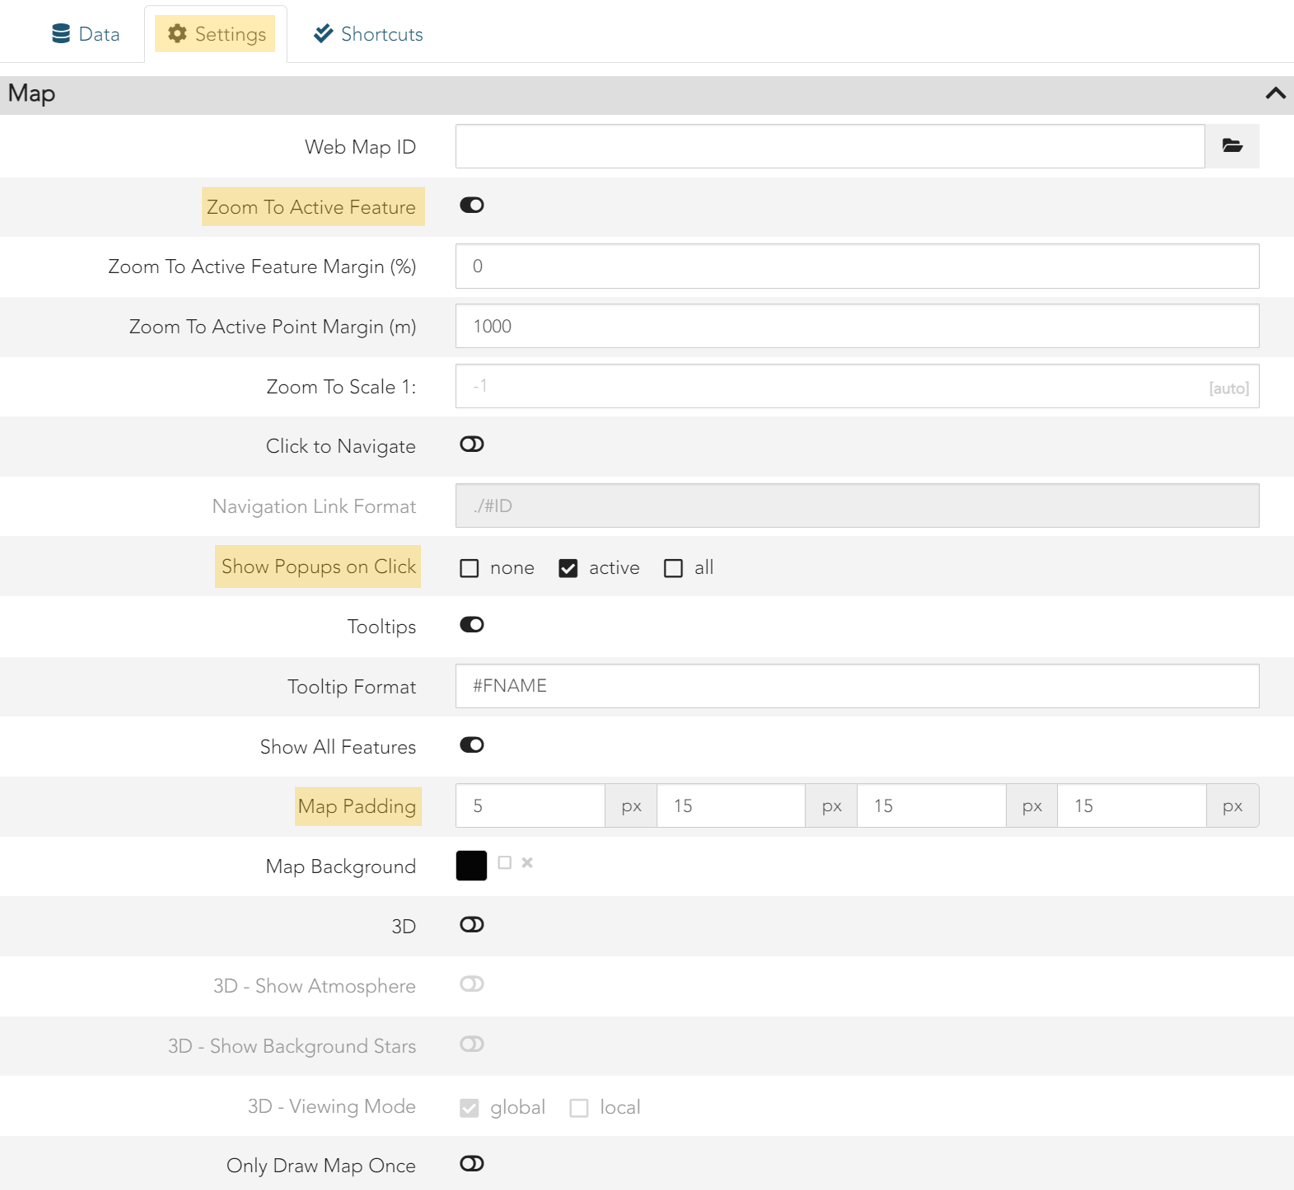
3. Begin by selecting the “Settings” tab on the top bar. You’ll first be greeted by the basic settings, which control where your map is located on the page. I personally prefer to alter the width and height of my maps from the main editing page instead, where you can drag them to the appropriate size, but it is good to know this is also an option. Use the “margin” option to alter the space around your map.
4. Within the Map settings, you’ll find a number of different options that control how people can interact with your map. I have highlighted the options that I have chosen to change for my map, so that it automatically zooms to the selected feature, pop ups appear when a region is clicked, and there is additional space around my map.
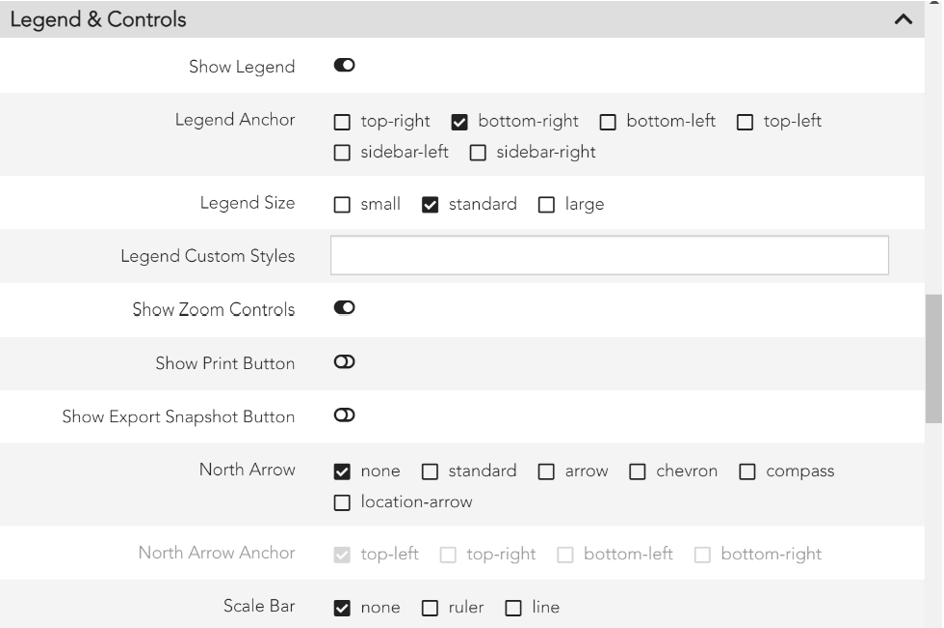
5. The Legend & Controls section is very self-explanatory, these options aid the reader in understanding your map. You can make decisions about how the legend appears and also what features of your map, such as a scale bar and an option to print the map.
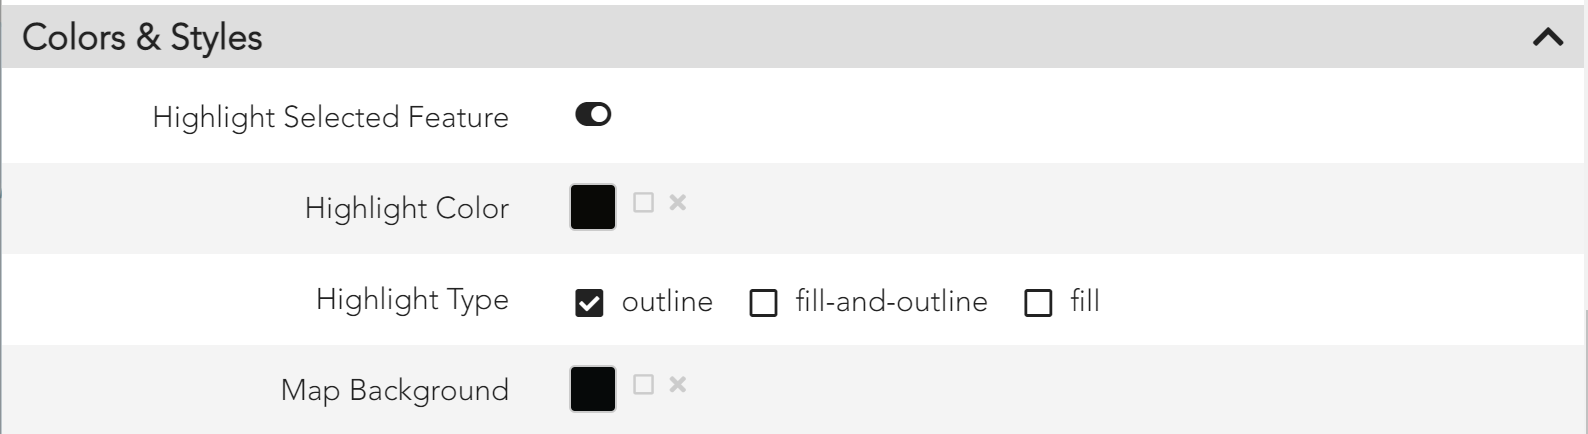
6. Use the Colours and Styles section to highlight your selected feature and make it stand out within your map. Change the map background option to alter the colour of the space around your map.
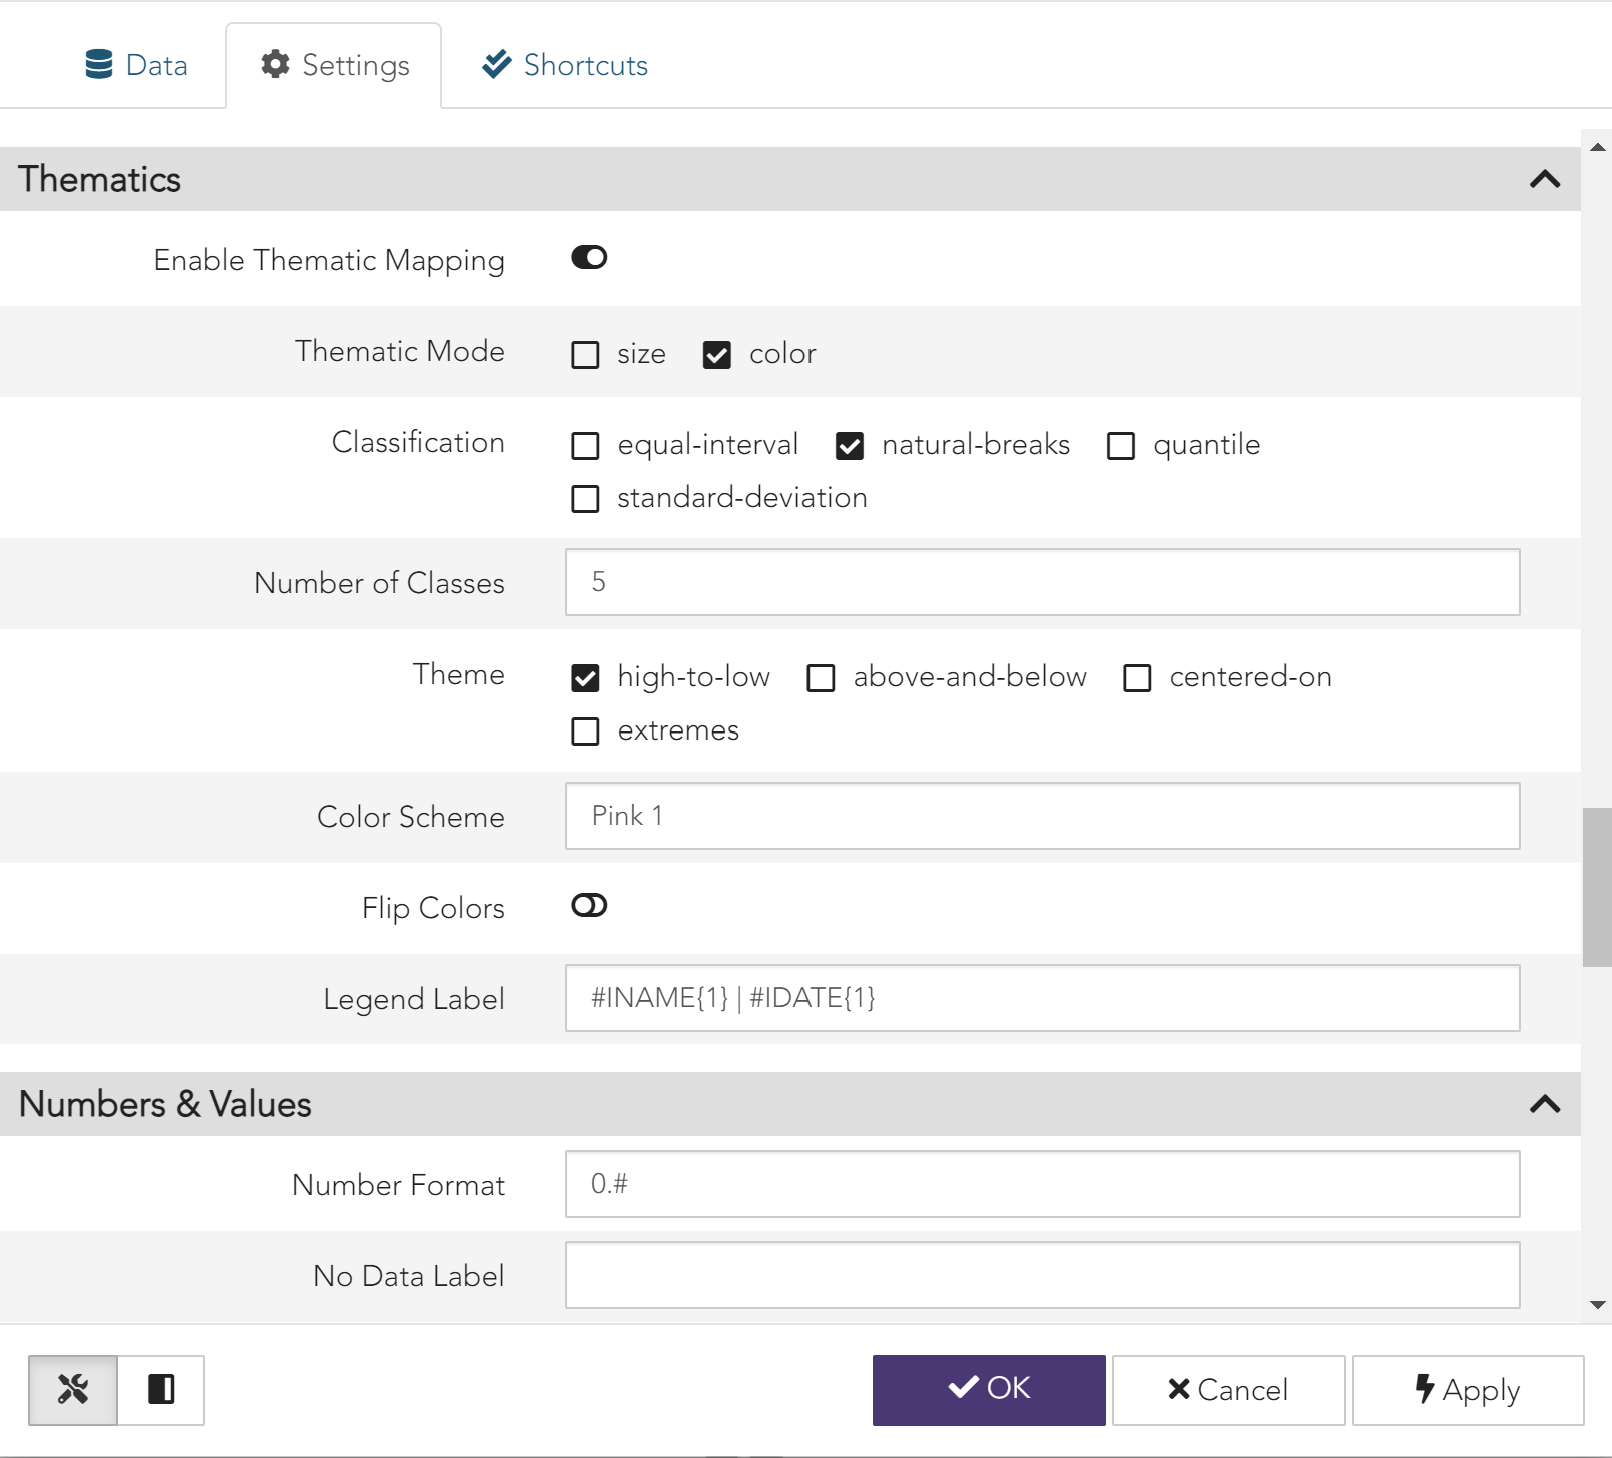
7. Thematic mapping focuses on the spatial pattern of a single topic or theme, such as population density or voting trends. Enabling thematic mapping is completely optional, and should be enabled if you would like to display a different topic than is shown through the original web map.
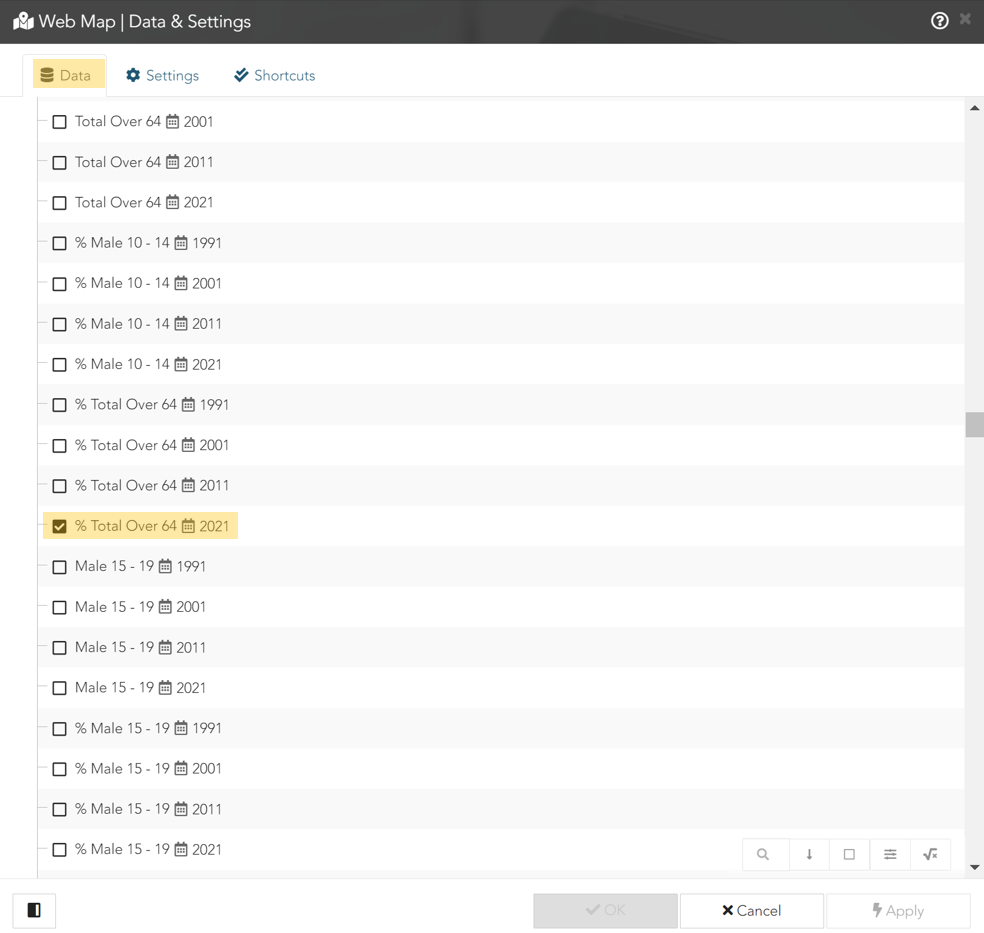
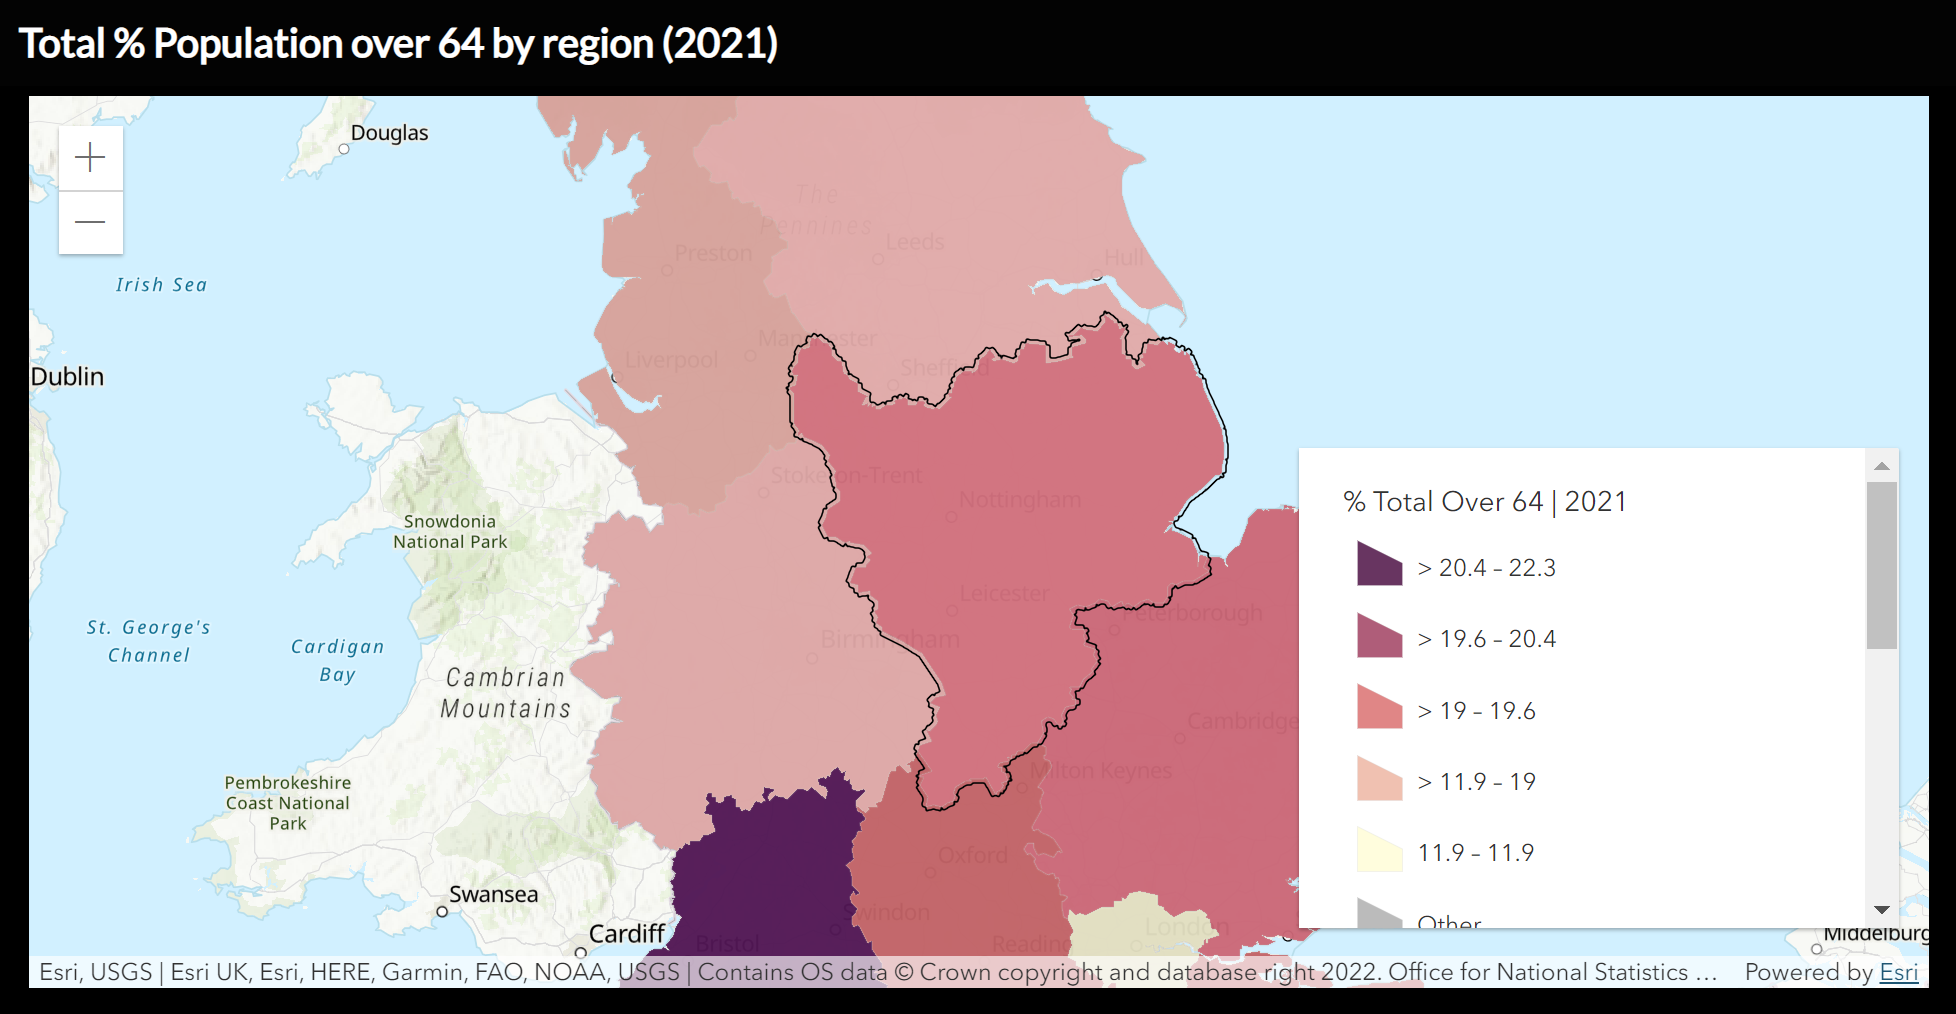
As an example, the census data I am using by default displays the total population for 2021, but I would actually like to show the Total % Population over 64 years of age. Therefore, I have navigated to the data tab and selected this from the indicator options.
I then used the variety of options within the Thematic tab to customise my map, so that the data was displayed exactly as I wanted.
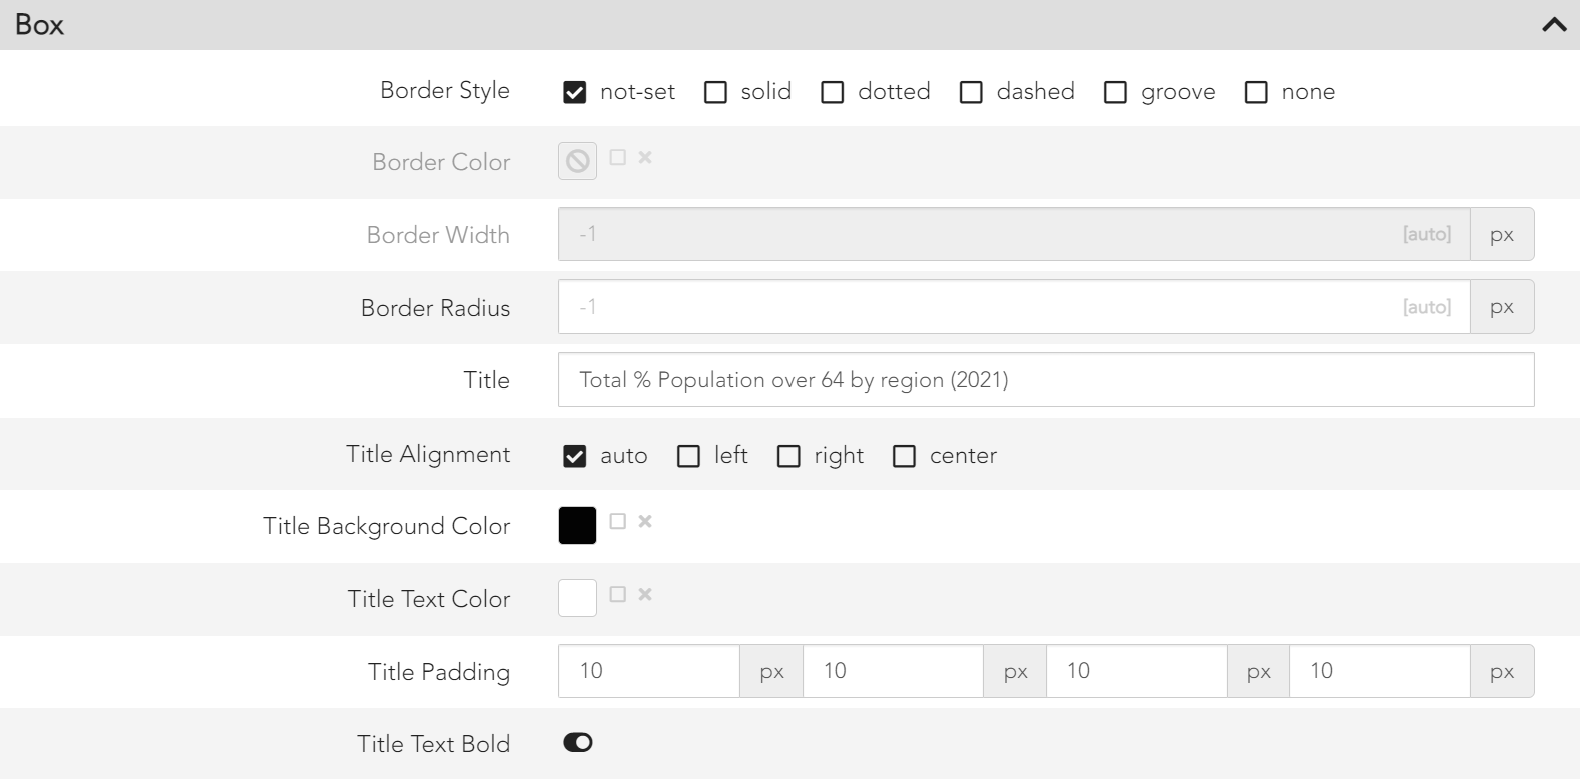
8. Finally, I used the Box settings to have even more personalisation over how my web map widget is displayed within the report. As you can see from the finished product below, I used these settings to add and customise my web map title.
Once you hit okay on the settings, you will be able to see your final output. Like with all other widgets, as you change the settings you can always click “apply” at the bottom of the settings window, to update your map changes as you go.
Alternative ways to add a web map:
While the Thematic settings within the web map widget do provide a large amount of customisation, perhaps an easier way to add a map that looks exactly as you’d like, is by designing it in ArcGIS Online and bringing it into Report Builder directly. This can be achieved through the ‘add Web Map ID’ option within the Map settings in the web map widget.
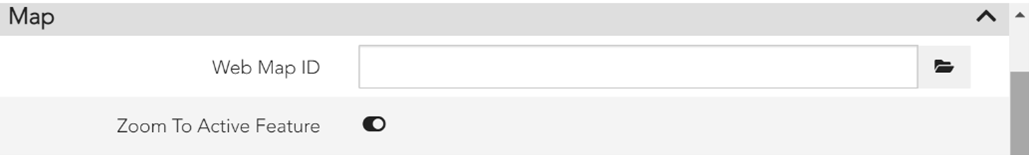
Clicking the file button on this option will bring up a list of all the web maps available for you to add. Initially, you will only see web maps from your organisation, but the toggle at the bottom of the pop up can be used to search the entire of ArcGIS Online. Use the search bar, also located at the bottom of the pop up, to search for a specific web map.
Using this option, we can bring in a different web map than is the focus of our report, to support the information we are presenting. As a reminder, so that the web map widget displays what you have configured in your ArcGIS Online Web Map, ensure that “Enable Thematic Mapping” is toggled off.
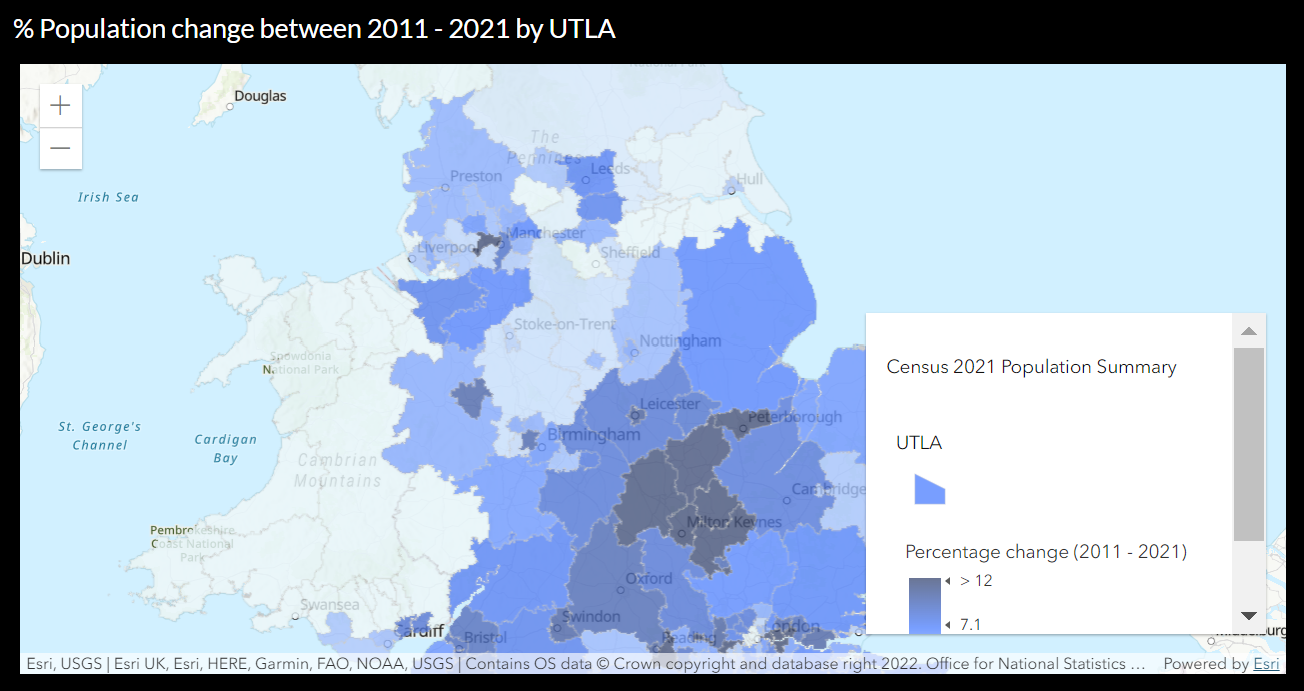
Top tip for using this option; if you toggle on “zoom to active feature” in the Map settings, your map will automatically zoom to the area your active feature is in, even if that layer is not on your web map. As an example, see the web map widget that I have configured below to go alongside my original web map, which is zoomed into the East Midlands area, but is actually displaying the % population change within UTLA boundaries.