
Overview
In version 2.4.0 of Report Builder we have continued to improve the behaviour of the chart widgets, following an upgrade of the charting library in the 2.3.0 update. We have also made changes to how Report Builder works with ArcGIS Enterprise as the data, storage and authentication platform instead of ArcGIS Online.
New features
Ability to add fixed lines and zones to bar and line charts
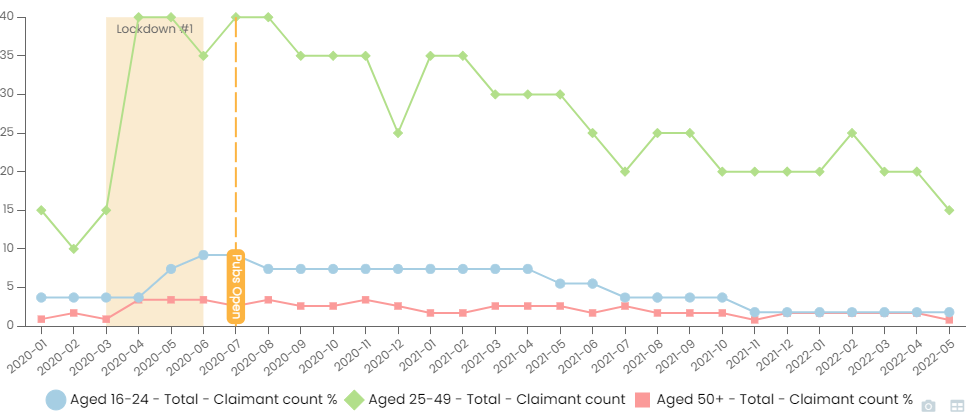
Bar and Line charts can now show fixed lines or zones additionally to the displayed indicator(s). You can add up to 4 lines and up to 4 zones to the chart. Each line has it’s own fixed value, label, colour, width and style. For each zone, the start and end value, label, colour and opacity can be defined. Lines and zones can be added to either the x or the y axis allowing for a wide rage of use cases.
Ability to add Mean and/or Median lines to bar charts
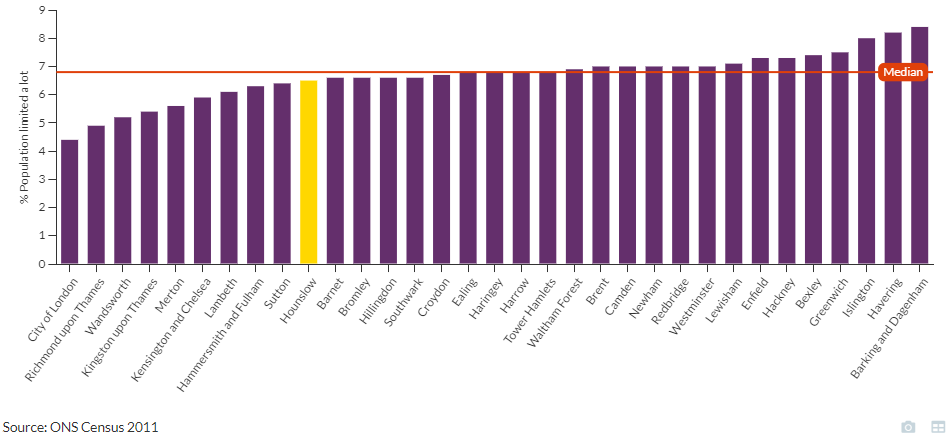
You can chose to display the mean and/or median line either superimposed over or behind the bars of your bar chart. The label, line style and colour can be adjusted.
Export/print options for web map widgets
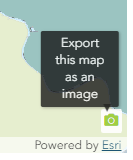
The simple version of exporting a web map widget is by enabling the Export Snapshot Button which will appear at the bottom right of the map. It takes a simple screenshot of the map widget and saves it to your browser’s downloads folder.
The more advanced Print Button allows the user to print the web map into different file formats, providing a range of options for size and layout.

Both these export options are mutually exclusive, meaning the Export Snapshot Button will only show if the Print Button setting is toggled off. Please note that the Print Button is not available for 3D maps.
Improved support for using data in ArcGIS Enterprise
Report Builder already supported the use of ArcGIS Server services where these services have been referenced in ArcGIS Online to make them easier to access and discover. In this update however, we have taken further steps to make it possible to use ArcGIS Enterprise as the data, storage and authentication platform instead of ArcGIS Online.
If you are hosting your own data catalog, and this is the data source for a report, the catalog table (master table) can include URLs to services from ArcGIS Enterprise and Report Builder will request and handle the authentication to these services appropriately. If the items are (semi)private you will be prompted to sign in to see the data in the report, whether you are editing the report or viewing it as an end user. An example of this is shown below.

Failure to sign in as a user with sufficient privileges will mean that any widgets in the report containing private data will not load.
Currently, the data catalog master table itself must be hosted in ArcGIS Online, but this is a step towards alternative deployments where the data catalog as well as the data services are hosted in ArcGIS Enterprise.
If you are interested in using Report Builder with data hosted in ArcGIS Enterprise we would like to know, so please get in touch with your Esri UK account manager.
Series Type of Pie Charts simplified
The setting Series Type for Pie Charts has been removed as it caused confusion. The rules now are:
- include all areas = true => one “pie” per indicator and each segment corresponds to a feature
- include all areas = false => one “pie” per feature (i.e. if you use show comparisons = true) and each segment corresponds to an indicator
Further enhancements
- You can now use the Configure App button within ArcGIS Online to open the edit version of the report.
- There is now an option to open the metadata pop-up when selecting indicators for text widgets.
- It is now possible to configure if comparison bars are displayed at the right of all other bars or included in the core feature bar sorting.
Key bug fixes
- Bar charts showing counts per value for a lower level comparison geography (for example the deprivation charts in our standard National Data Service reports) no longer show the x-axis labels in random order.
- Bar charts showing one indicator for all areas can again display comparison values as horizontal lines.
- It is again possible to create a pie chart showing only one percentage indicator value and filling the remaining pie to 100%.
- Metadata pop-ups in the data selection dialogs as well as in the table now hide empty fields.
- Time Series Table: Metadata icons are no longer hidden when group-rows-by-indicator is active.
- Charts are no longer cut off at the bottom if Title Position is set to title-bar.
- Width and Height settings of widgets are now rounded to full numbers when resizing the widget by dragging the handlers.
- All infographic widgets now have setting to enable and disable comparison features.
- Indicator search option within the widget’s Data & Settings dialog is working reliably even for indicators with special characters or multiple whitespaces in the indicator name.
We hope you will enjoy this new release of Report Builder!
If you have any questions relating to this release please contact Esri UK Technical Support. Customers outside of the UK and Ireland please email support@instantatlas.com.