
After a report has been newly published, the data values that are being displayed in the report are example values generated by the Publisher. You can use the InstantAtlas Excel Data Manager to create a JSON data file that contains your own values. To do this, follow the steps below. You can close the InstantAtlas Publisher using the ‘Exit’ button if you have not already done so.
Activating the Excel Add-in
When you installed the InstantAtlas software, the InstantAtlas Excel Data Manager add-in was automatically copied to the installation folder. This is a supplemental program that will extend the functionality of Excel so that it can generate JSON data files for your InstantAtlas HTML reports. You will need to enable the add-in in order for the InstantAtlas menu and toolbar to appear.
Excel 2016 and later
Open Excel. Click the ‘File’ tab in the ribbon and select ‘Options’ in the left hand menu.
This should launch the Excel Options Window. In the left hand pane, choose Add-ins which will bring up the list of installed add-ins and whether they are active (enabled) or not.
Initially the IA Data Manager may be in the list but it will not be active. To activate it, click the ‘Go’ button at the bottom of the add-in screen in order to start managing your add-ins.
If the IA Data Manager is not present in the Add-Ins dialog, click ‘Browse…’ and browse to the file called ‘IA Data Manager.xla’ which is located in the root folder of the InstantAtlas Desktop installation, usually ‘C:\Program Files\EsriUK\InstantAtlas’, and click OK. It will now be available in the list of Add-Ins.
Select the InstantAtlas Data Manager from the checklist and click ‘OK’.
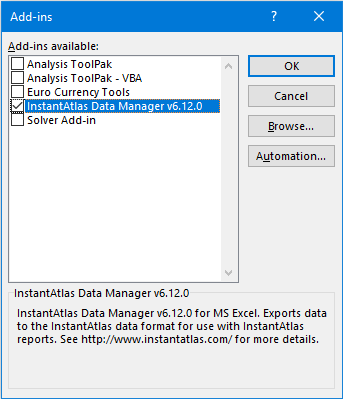
If you have multiple versions of the add-in available because you have upgraded from a previous version of InstantAtlas, please ensure that the most recent version has been enabled.
You will now need to close and then reopen Excel.
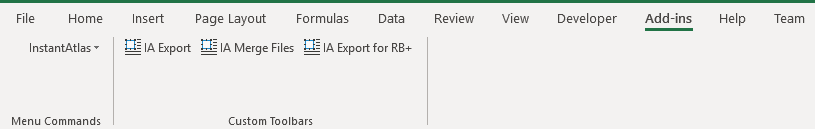
The add-ins tab should now display three new buttons. There is also a menu item called InstantAtlas from which these functions can also be selected.
Creating Some New Data
The Excel add-in is used in conjunction with any workbook in which you enter your data. An example workbook has been provided with your InstantAtlas software. Use the InstantAtlas Excel Data Manager shortcut created in the Windows Start menu to open the workbook. Alternatively, you can browse to the ‘IAworkbook.xls’ file created during installation, the default location of which is C:\Program Files\EsriUK\InstantAtlas\workbooks\. Click on the name of the ‘Example 1 iadatasheet’ worksheet at the bottom of the screen.
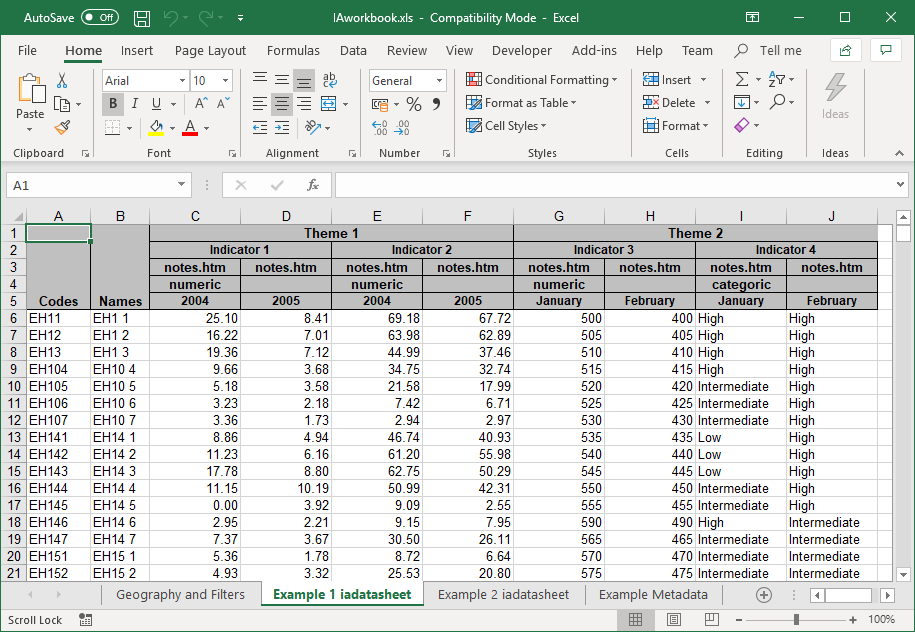
You will see that columns A and B contain codes and names identifying each of the post code sectors. Columns C onwards contain data values. Data must be organised using three levels in InstantAtlas reports: theme, indicator and time period. You can see that in this datasheet there are two themes (Theme 1 and Theme 2). Theme 1 contains two indicators (Indicator 1 and Indicator 2) and Theme 2 also contains two indicators (Indicator 3 and Indicator 4). Each indicator has two time periods.
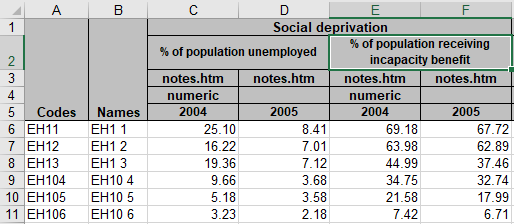
Change the value in cell C1 from ‘Theme 1’ to ‘Social deprivation’. Change the value in cell C2 from ‘Indicator 1’ to ‘% of population unemployed’. Change the value in cell E2 from ‘Indicator 2’ to ‘% of population receiving incapacity benefit’. You can replace some of the data values below with your own values if you wish.
Now that you have created some of your own theme and indicator names, you can update the report with this data.
Updating the Report
To use the Excel Data Manager add-in you must have at least one active datasheet in your workbook. A worksheet becomes an active datasheet when its name starts with ‘iadatasheet’. To rename the worksheet ‘Example 1 iadatasheet’ in Excel, you simply right click on the worksheet name and select ‘Rename’.
Click the ‘InstantAtlas’ menu in Excel and then click ‘Export Data File’. Alternatively click the ‘IA Export’ button in the InstantAtlas toolbar. A dialog box will open in which you are asked to select the file type. Data files for HTML dynamic reports need to be in JSON format. The option to export to XML format exists for debugging purposes, as the XML format is more human-readable. Please select the JSON option.
Please also ensure that the option ‘Generate data file for local atlas’ is ticked. This will ensure that the local file variant of the data.js file called data-vars.js.js is also updated.
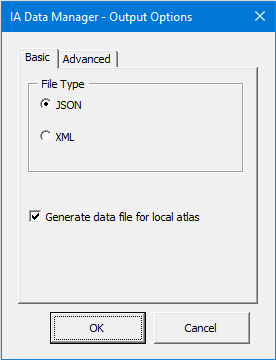
Click OK. You will be prompted to browse for a destination folder.
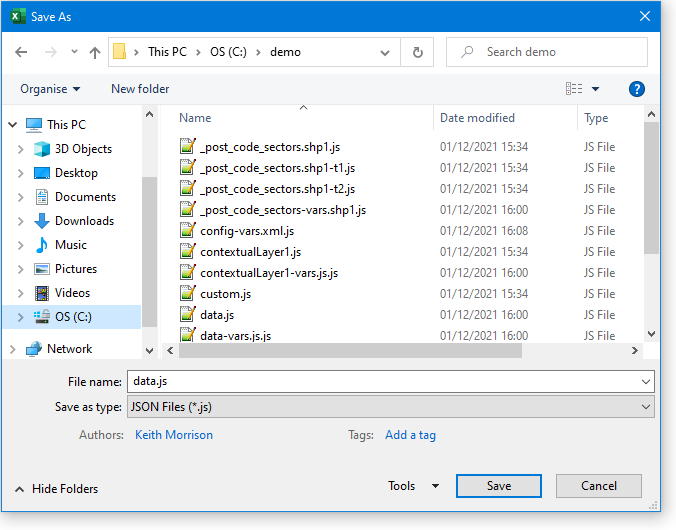
Browse to your report folder (i.e. C:\demo) and click ‘Save’.
![]() You should not change the filename away from ‘data.js’.
You should not change the filename away from ‘data.js’.
If your InstantAtlas report is still open, click the ‘Refresh’ button in the browser to restart the report. If the report is not open, browse to the report folder and double click the ‘atlas.html’ file to start it. The report should now look similar to this:
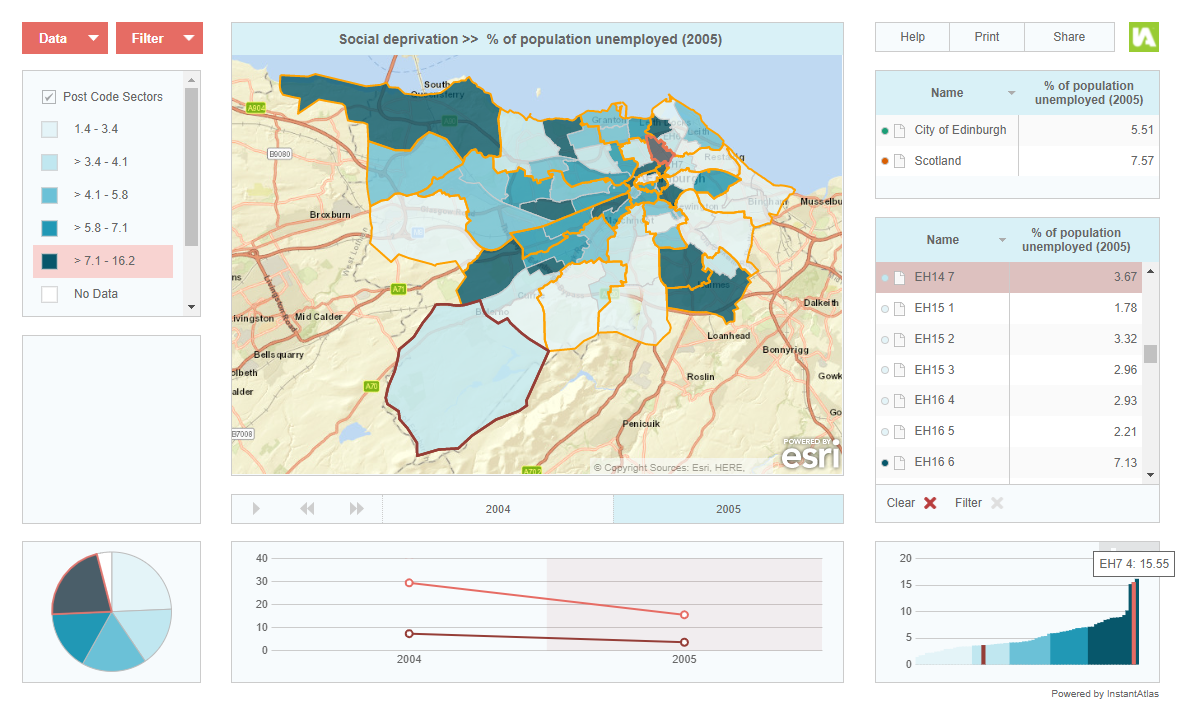
Click the ‘Data’ button (top left). You will see that the theme and indicator names that you entered into the Excel workbook are displayed.