
It is possible to change the design (i.e. layout and configuration) of your InstantAtlas report. This section describes making your first changes using the Designer.
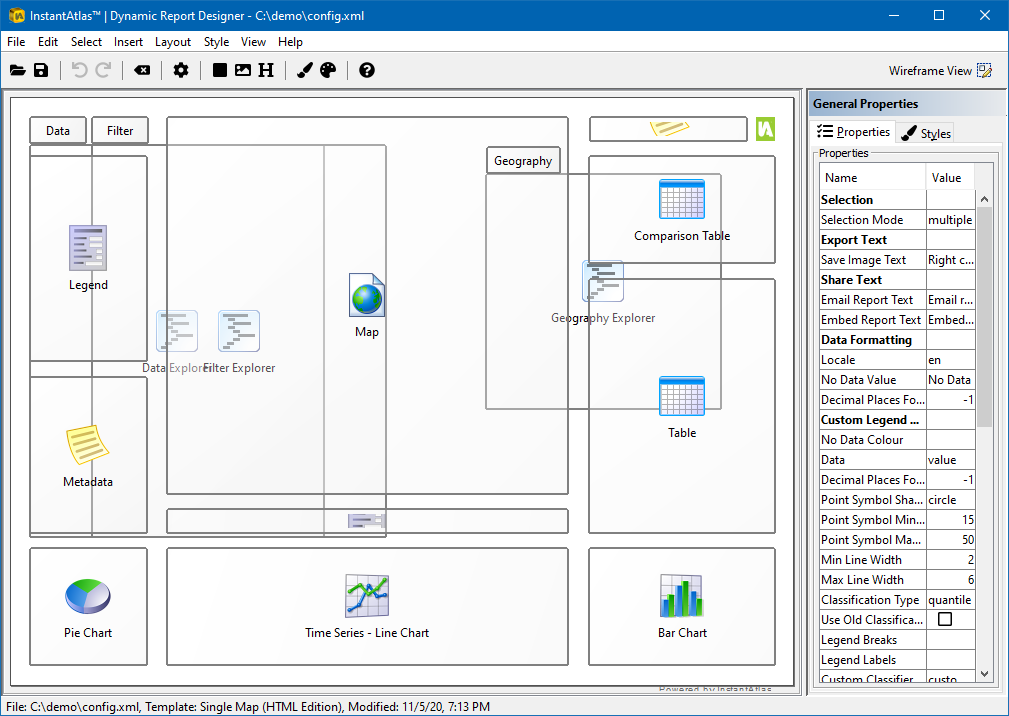
By default the report allows multiple selection. Users can more readily compare multiple selected features by using the Selected Features Legend. You must use the Designer to insert this component. Double click the configuration file called config.xml that is located in the report folder. The Designer will open with the canvas showing the current layout of the report in wire frame view.
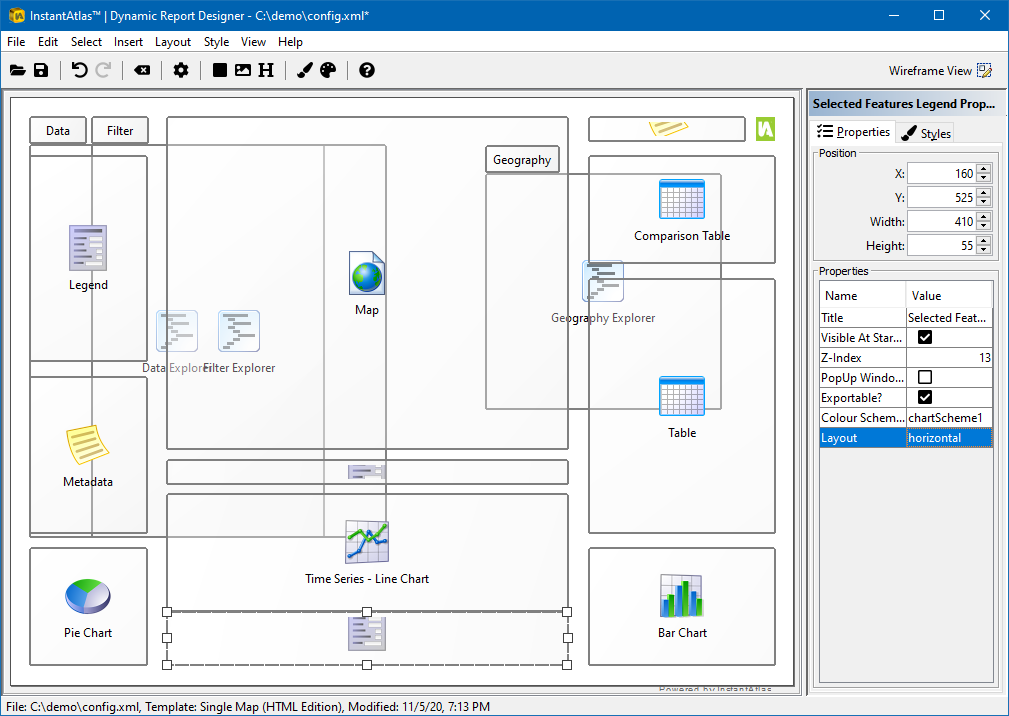
To add the Selected Features Legend click on ‘Insert’ in the menu bar and select ‘Selected Features Legend’. Once inserted, the Selected Features Legend will appear in the center of the report. To change the look and feel of your dynamic report you can now move the components by dragging them and rescale them by clicking on the borders or corners of the components (a double arrow appears). For example, make the map a bit shorter and move up the Time Animation and Time Series Chart components, then move and resize the Selected Features Legend to sit underneath the Time Series Chart. You will also need to change the property called ‘Layout’ to the value ‘horizontal’ in the right hand side properties panel.
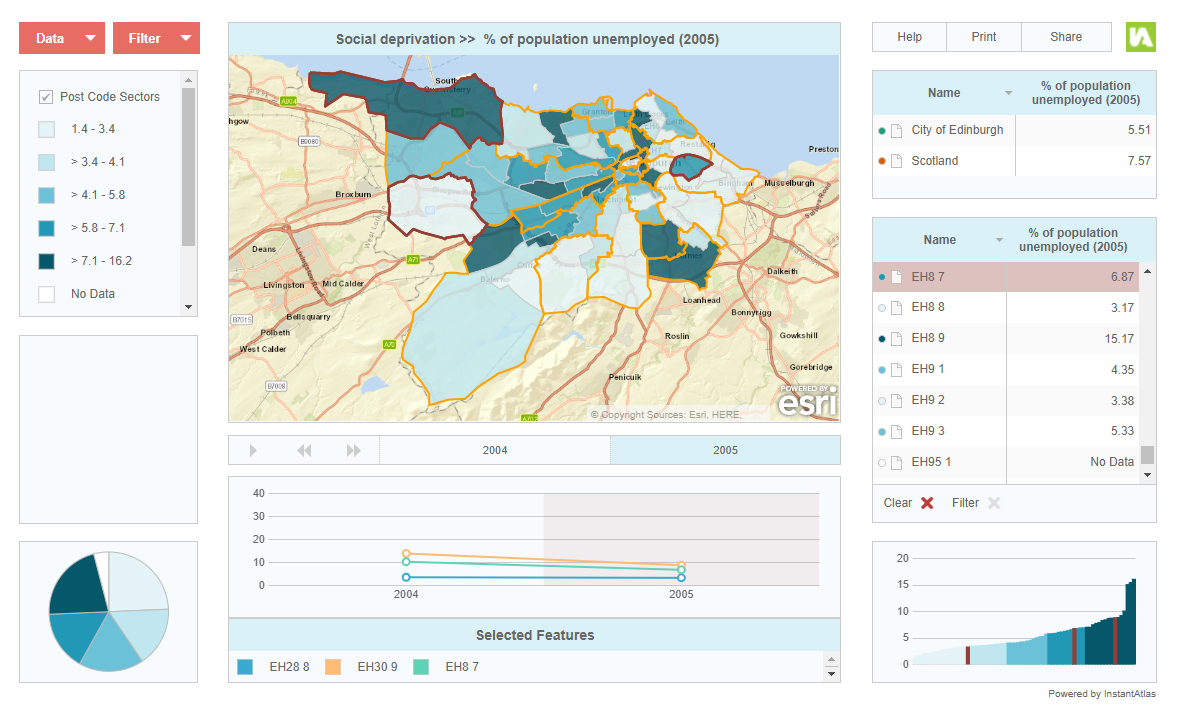
Click the Save icon in the toolbar to save the configuration file and refresh your Internet browser to see the changes in your dynamic report. When multiple features are selected they will now be assigned a different colour on the Time Series Chart which is denoted in the Selected Features Legend.
You have now successfully published your first InstantAtlas dynamic report and have updated it with new indicator data. To learn more about using InstantAtlas you should read the InstantAtlas Desktop User Guide.