This section will take you through the steps required to publish an InstantAtlas dynamic report.
Starting the InstantAtlas Publisher
The Publisher enables you to publish a report using the template and geographies of your choice. It is a wizard style application that will lead you through the steps required to create a report. Each screen has a ‘Next’ and a ‘Back’ button to allow you to step both forwards and backwards through the Publisher.
To start the Publisher, use the shortcut added to the Windows Start menu or on the desktop during software installation.

Alternatively, you can browse to the ‘InstantAtlasPublisher.exe’ file. The default location for this is C:\Program Files\EsriUK\InstantAtlas.
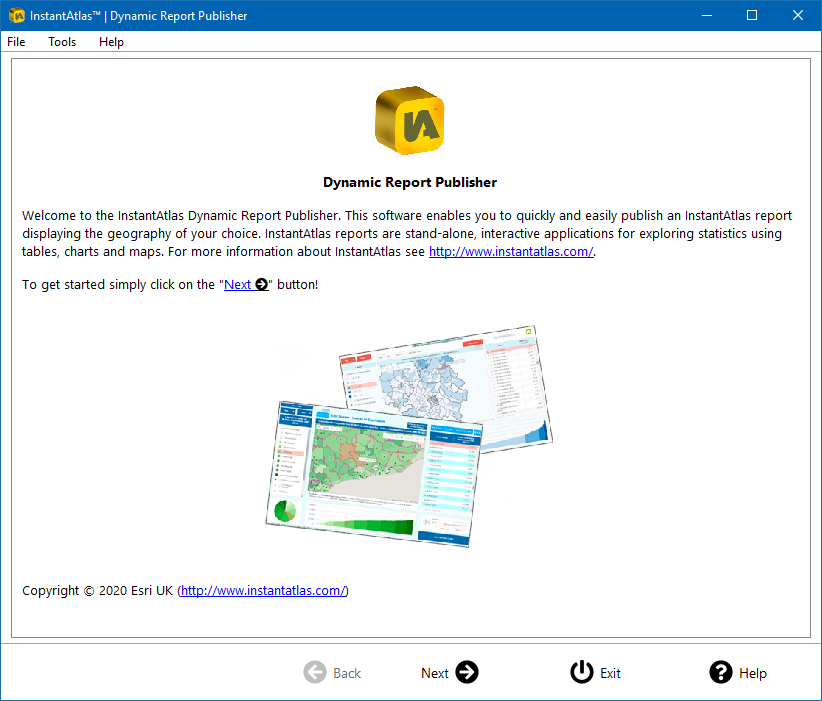
Once the Publisher has finished loading, you will see the ‘Welcome’ screen:
Click the ‘Next’ button to progress to the following screen.
Choose a Template
The first step in the publishing process involves choosing a template. Every InstantAtlas dynamic report you publish is based on a template. A template dictates the core appearance and functionality of a report. To publish your first report select the Single Map (HTML Edition) template.
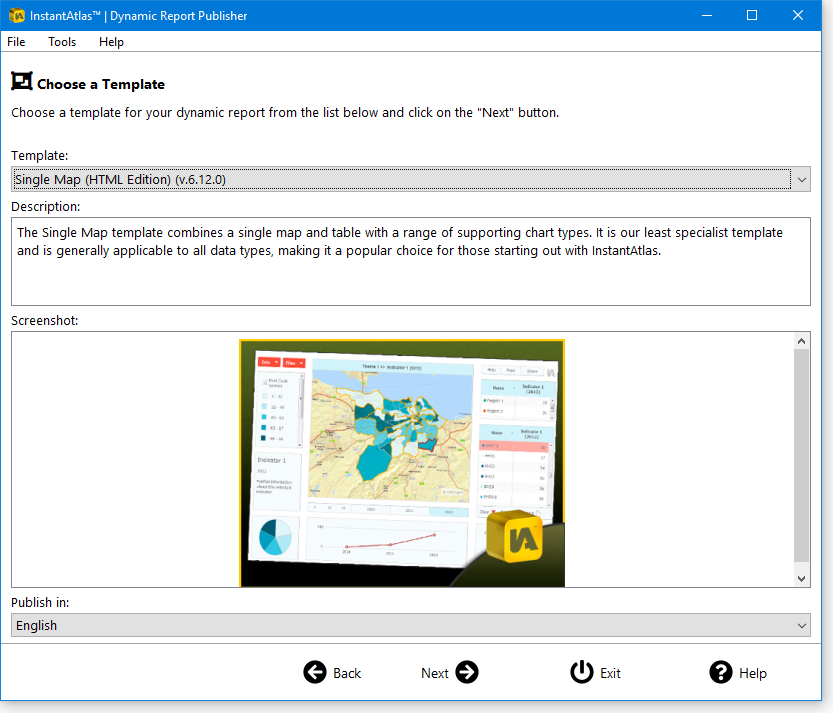
Once you have made your selection, click the ‘Next’ button.
Choose Your Base Geography
This step of the publishing process involves choosing a digital map file with the base geography for your report. A digital map file is simply a representation of geographic features in digital format (as opposed to a paper map for example). Base geography is defined as the set of geographic features that you wish to produce a thematic map for. If, for example, you wish to map social exclusion statistics by post code sector for the city of Edinburgh (United Kingdom), your base geography is post code sectors for the city of Edinburgh.
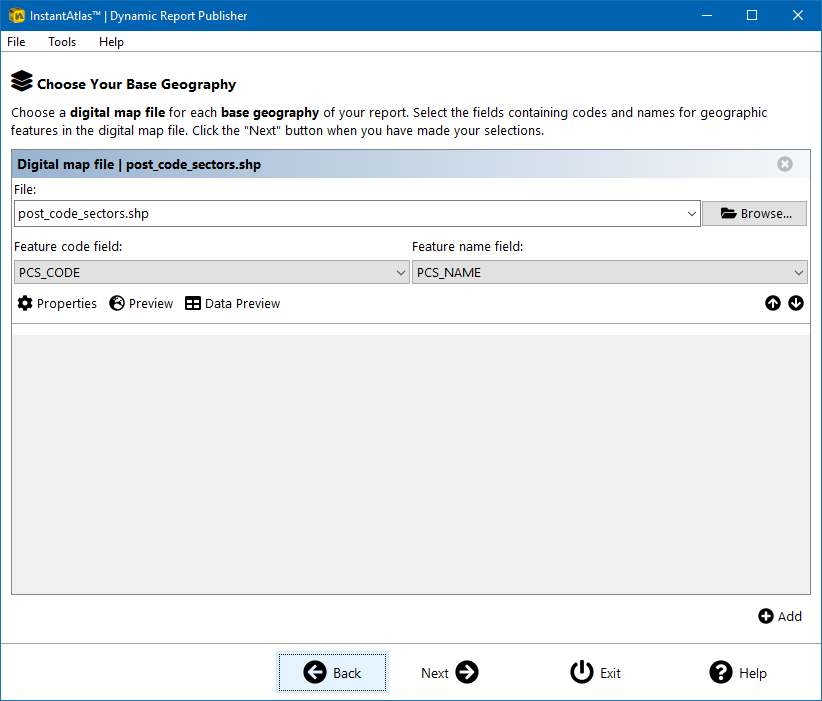
To publish your first report you should choose the sample digital map file supplied with your InstantAtlas software. This contains post code sector boundaries for the city of Edinburgh. Click the ‘Browse’ button and browse for the map file called ‘post_code_sectors.shp’ located in the ‘maps’ folder created during installation of your InstantAtlas software. The default location for this file is ‘C:\Program Files\EsriUK\InstantAtlas\maps’.
Make sure you pick post_code_sectors.shp and not post_code_districts.shp!
Click the arrow to the right of the ‘Feature code field’ drop down list and select ‘PCS_CODE’. Click the arrow to the right of the ‘Feature name field’ drop down list and select ‘PCS_NAME’.
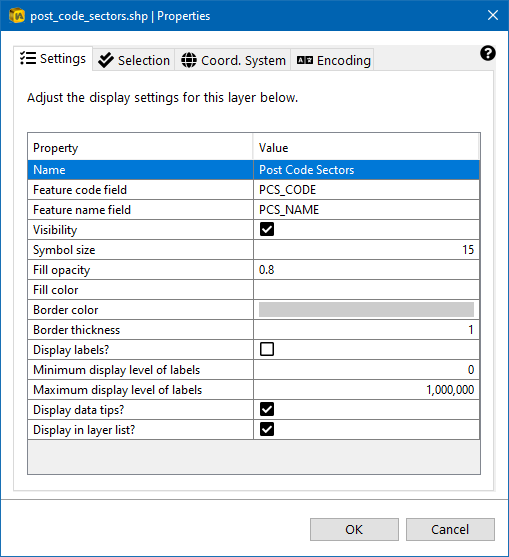
Now click the ‘Properties’ Button to open the layer properties dialog. Change the name of this layer from ‘post_code_sectors.shp’ to ‘Post Code Sectors’. Do not change any of the other settings.
Then click the ‘OK’ button to return to the main screen and click the ‘Next’ button.
Choose Your Contextual Geographies
This step of the publishing process involves choosing contextual geographies if these are required. Contextual geographies overlay the base geography and provide context for the map(s) in your report. You may select one or multiple contextual geographies. You do not have to include contextual geographies.
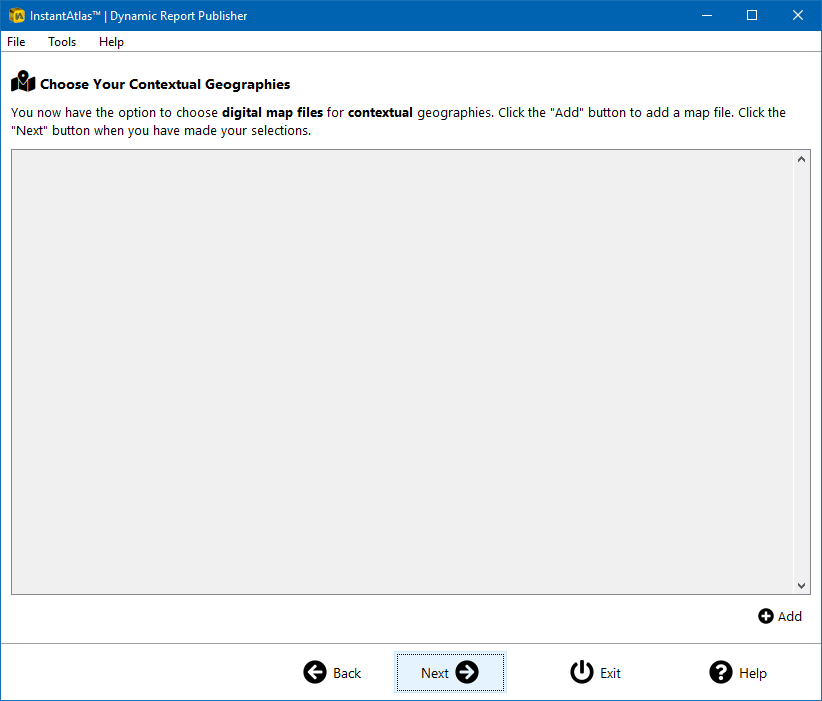
Add the sample digital map file containing post code district boundaries for the city of Edinburgh supplied with your InstantAtlas software. This is a higher level geography – post code sectors are grouped into post code districts.
Click the ‘Add’ button and select the ‘Digital Map File’ option to add a contextual geography to the screen. Then click the ‘Browse’ button and browse for the map file called ‘post_code_districts.shp’ located in the ‘maps’ folder created during installation of your InstantAtlas software. The default path for this file is ‘C:\Program Files\EsriUK\InstantAtlas\maps’. Make sure you pick post_code_districts.shp and not post_code_sectors.shp.
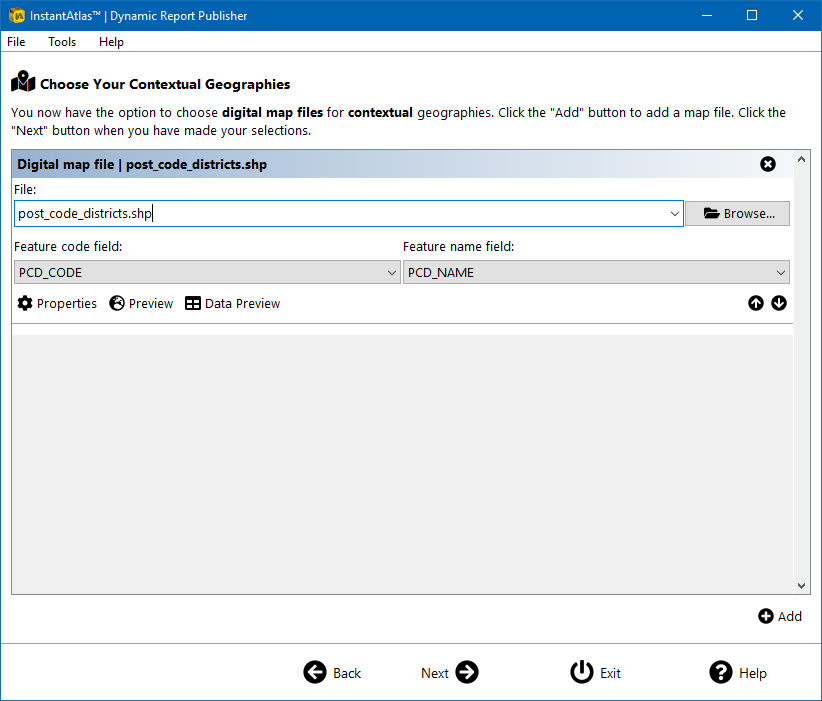
Click the arrow to the right of the ‘Feature code field’ drop down list and select ‘PCD_CODE’. Click the arrow to the right of the ‘Feature name field’ drop down list and select ‘PCD_NAME’.
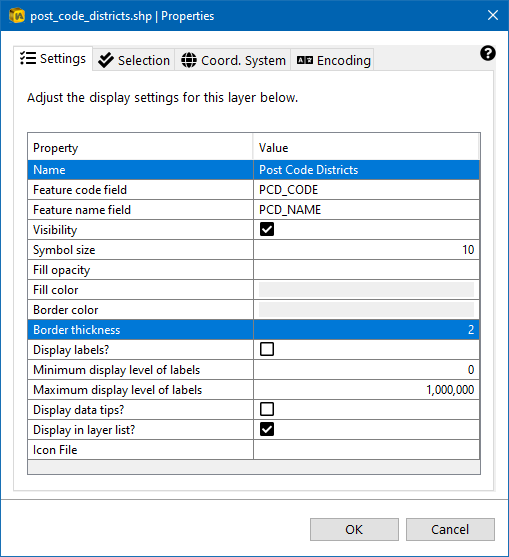
Now click the ‘Properties’ Button to open the layer properties dialog. Change the name of this layer from ‘post_code_districts.shp’ to ‘Post Code Districts’ and change the border thickness to 2px. Do not change any of the other settings.
Then click the ‘OK’ button to return to the main screen and click the ‘Next’ button.
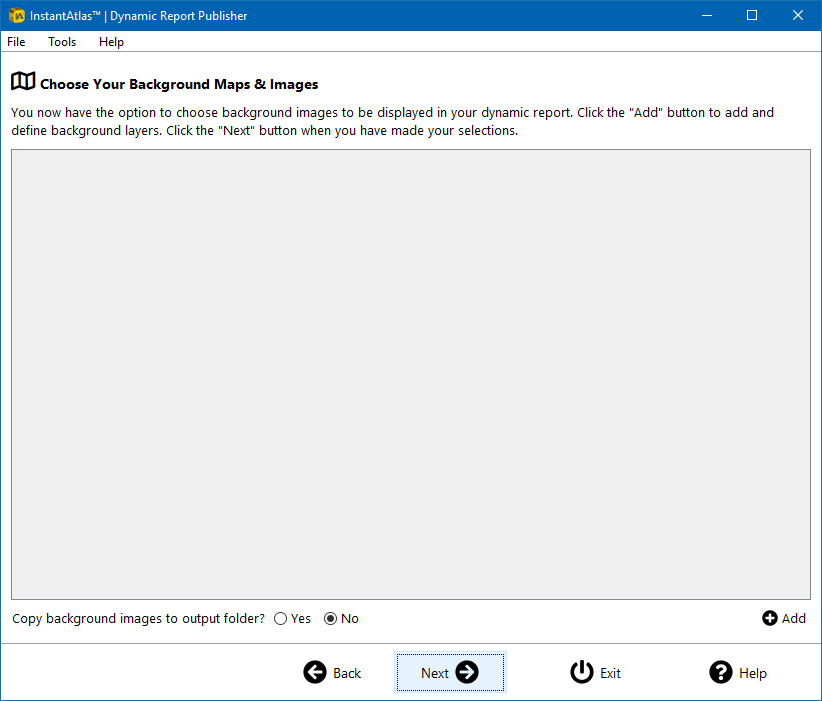
Choose Your Background Images
This step of the publishing process involves choosing background images if these are required. Background images appear in the map(s) of your report and provide additional context. They can either take the form of a local collection of images (JPG or PNG format), a Web Map Service (WMS), an ArcGIS Server map service (such as ArcGIS Online), OpenStreetMap or Google Maps.
![]() The use of map data is subject to the terms of the provider and it is the responsibility of the owner of the report ensure compliance.
The use of map data is subject to the terms of the provider and it is the responsibility of the owner of the report ensure compliance.
ArcGIS Online provides ready-to-use map services with coverage for many countries. You can find more information about ArcGIS Online here:
https://livingatlas.arcgis.com/en/browse/#d=2&cont=true&categories=Basemaps%3A10000
Click the ‘Add’ button and then ‘ArcGIS Server / ArcGIS Online Connection’ to add a background mapping layer to the screen. For this report an ArcGIS Online map service with a World Street Map layer will be used. The URL to this service is:
https://server.arcgisonline.com/ArcGIS/rest/services/World_Street_Map/MapServer?
Copy and paste the URL to the ArcGIS Online Service into the ‘Server address (URL)’ field. Alternatively you can select ‘World Street Map (ArcGIS Online)’ from the drop down list.
Now click the ‘Refresh…’ button. The ‘Map layers’ and ‘Coordinate system’ drop down list should populate.
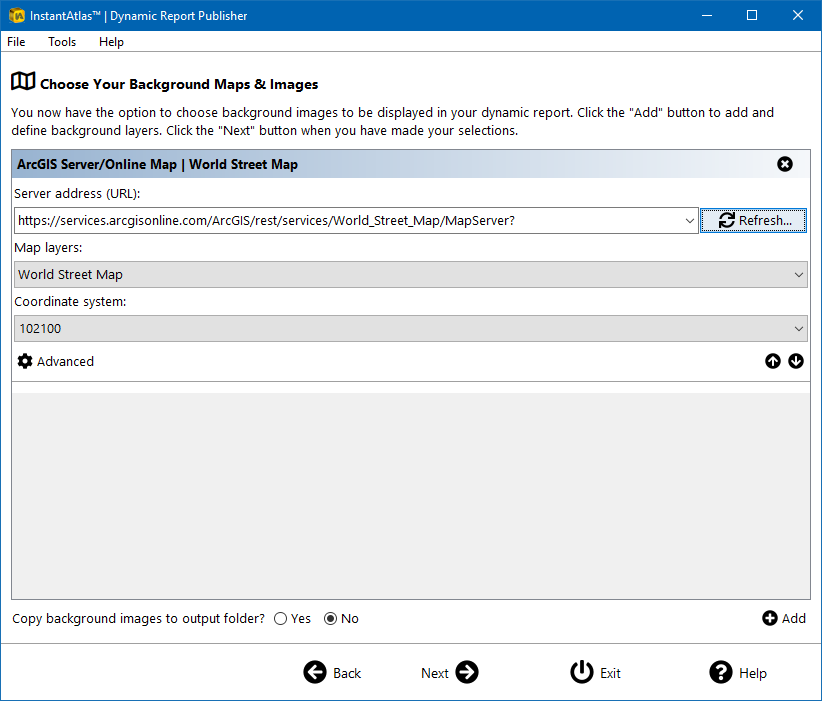
The projection of this ArcGIS Online layer is ‘WGS 1984 Web Mercator (AuxiliarySphere)’ also referred to as ‘102100’. The Publisher will automatically re-project the digital map files used for the base and contextual layers in order to match the ArcGIS Online imagery.
![]() If you receive an error message after clicking on ‘Refresh…’ it is likely that your network is preventing the Publisher from accessing this external content from the Internet. You should raise this with your network administrator. Meanwhile you can remove the ArcGIS Server background layer by clicking on the ‘remove’ button (
If you receive an error message after clicking on ‘Refresh…’ it is likely that your network is preventing the Publisher from accessing this external content from the Internet. You should raise this with your network administrator. Meanwhile you can remove the ArcGIS Server background layer by clicking on the ‘remove’ button (![]() ). Your report will then be published without a background layer.
). Your report will then be published without a background layer.
Now click the ‘Next’ button.
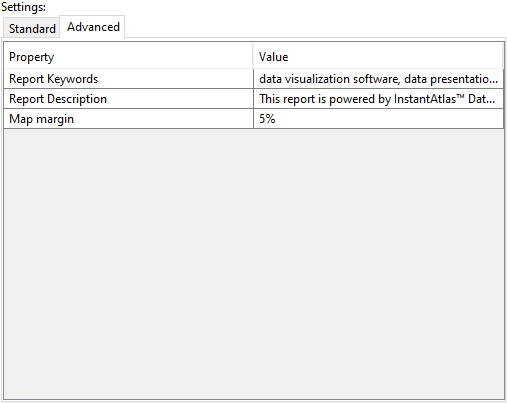
Choose Settings For Your Dynamic Report
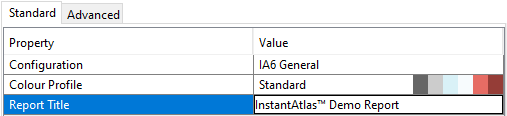
This step of the publishing process involves editing settings for your dynamic report. The list of properties may look different to that shown in the image below depending on the template selected previously.
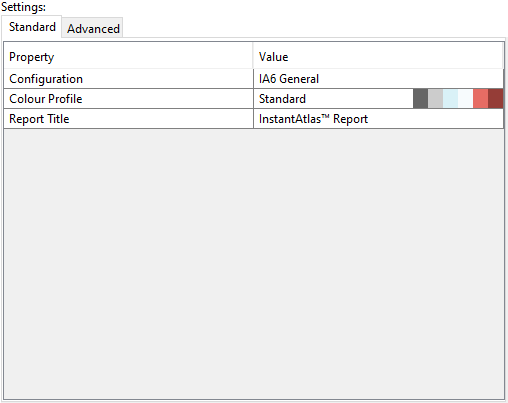
Double click into the ‘Value’ cell of the ‘Report Title‘ and change it from ‘InstantAtlas™ Report’ to ‘InstantAtlas™ Demo Report’.
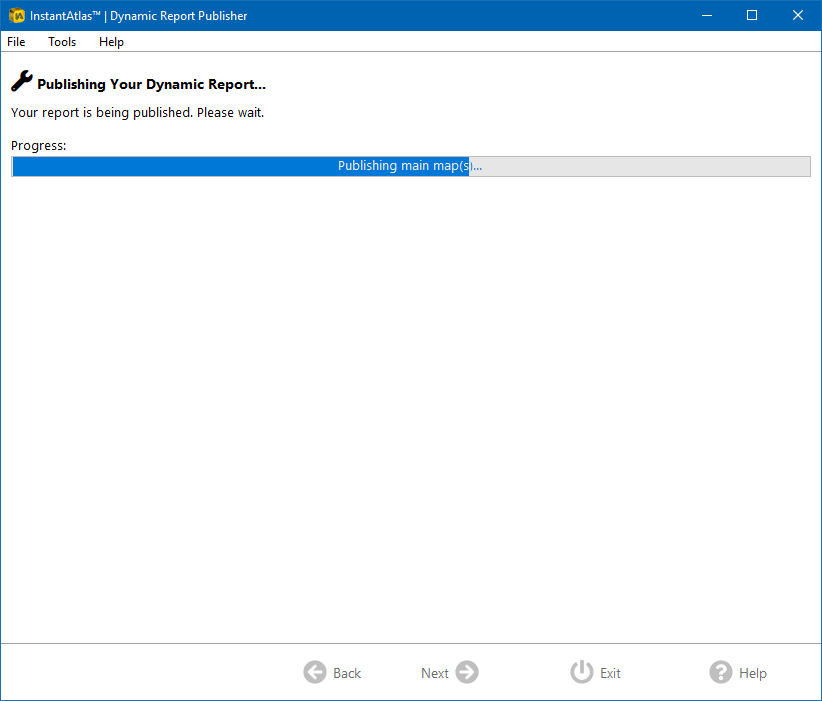
Then click the ‘Publish’ button. A progress bar will indicate that your dynamic report is being created.
Unpacking and Starting Your Dynamic Report
This is the final step of the publishing process. Your dynamic report has been published and is contained in a ZIP archive (.zip file extension), the name of which is provided at the top of the screen. The archive contains the set of files that make up your dynamic report in a compressed form. An archive is a convenient way of storing and transferring these files.
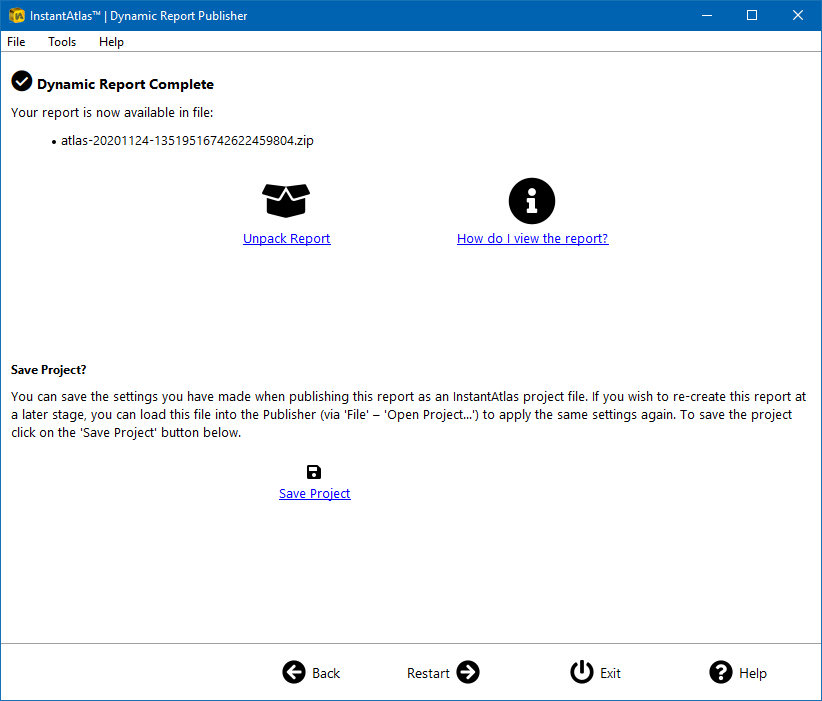
Click the ‘Unpack Report’ button to unpack the files contained in the archive. The Publisher will ask you which folder you would like to extract the files to. For each new report, we suggest you create a new folder to contain the report e.g. create a new folder called ‘demo’ in the root of your C: drive. If you already have a folder called ‘demo’ on the C: drive of your computer, choose a different name for your output folder. Then click the ‘Select’ button.
After a brief delay, a message will inform you that your new report has been unpacked.
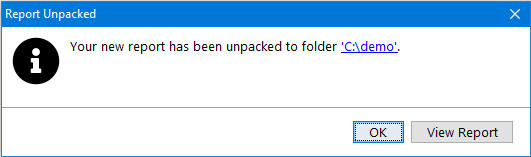
You may wish to follow the link to your report folder to open it in your File Explorer. Then click on ‘View Report’ to open your dynamic report. Please ensure you read the information about Starting Your Dynamic Report.
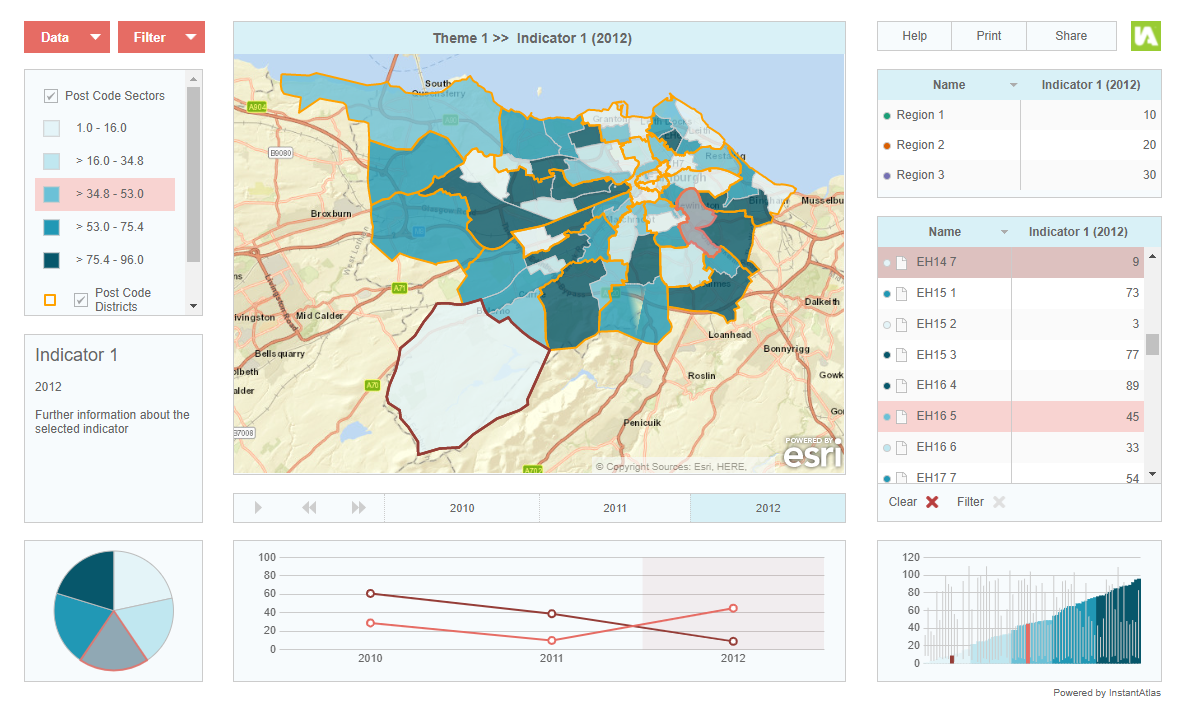
Once the report has opened, it should look similar to that displayed below. Try moving your mouse over the map and clicking on some of the buttons. You can toggle your map layers by clicking the check boxes in the legend.