Configuration
The Health Profile configuration is similar to the Performance Results configuration but with two main differences: the shaded ranges are centred around a national (or regional) benchmark and the indicator value is represented by a shaded point rather than a bar, with the shading representing the statistical significance.
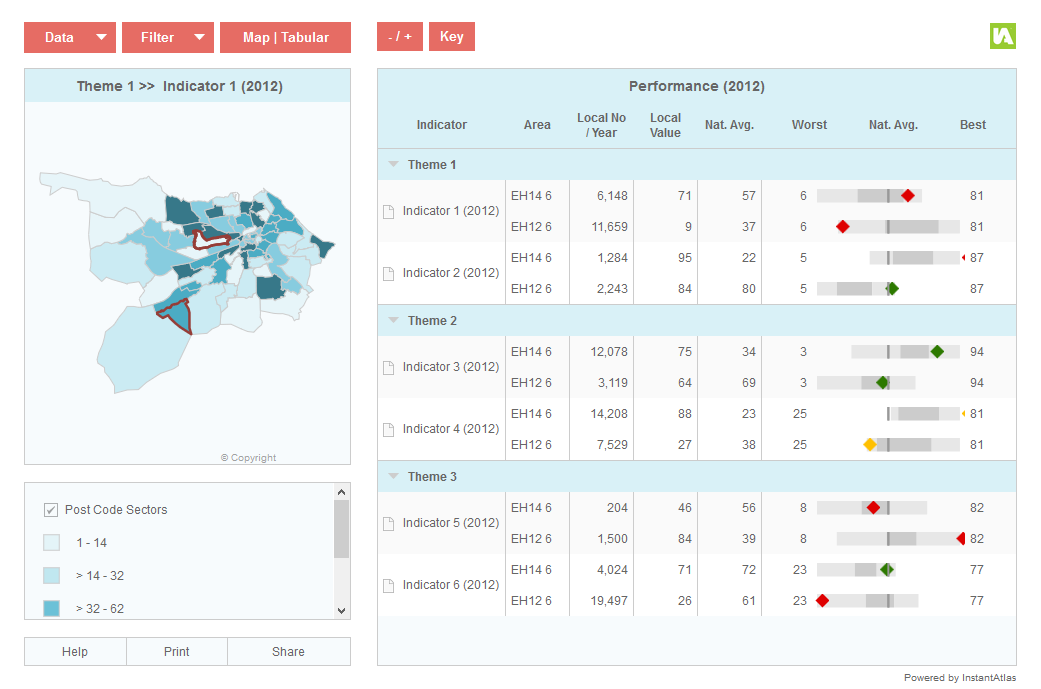
This view has proved to be popular with organisations for visualising public health indicators.
Again, you can alter this configuration once you have published a report by opening the config.xml file using the Designer. For example, you might decide to remove the Nat. Avg. column or to change the symbols that are displayed in the spine chart. Please see section ‘Area Profile – Spine Chart’, sub-section ‘Configuration’ for further information.
Data Preparation
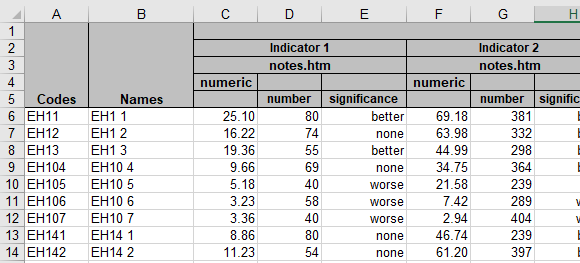
For each indicator you include in your report you may wish to provide the following associates in the JSON data file(s). These match the default configuration of the chart:
number – count value for the indicators
significance – values from this column are used to define symbols in the spine chart
The suggested data structure is shown in the ‘iadatasheet’ worksheet of the workbook called IAworkbookHealthProfile.xls. This is also in the ‘workbooks’ folder of your InstantAtlas installation.
Please note that you do not have to provide each of the mentioned associates, however if you provide more, less or use different column names you will have to modify the configuration settings in the Designer to match your data.
By default the report will use a comparsion area with the id ‘national’ as the centered benchmark line. If you wish to use a comparsison area with a different id you can change this by amending the setting ‘Target 1 Use Comparison Feature’ in the Spine Chart properties of the config.xml file. You will aslo need to adjust the ‘comparisonFeature’ parameter of the the ‘health(…)’ function that defines the content of this column:
health(symbolValue:significance,areaValue:value,nationalValue:value,comparisonFeature:national)
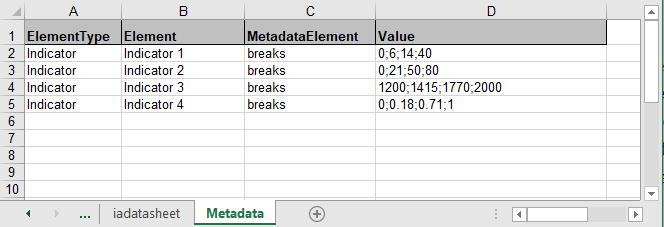
The breaks are calculated automatically for each year for each indicator as quartiles. There is no need to add custom breaks to Metadata unless you wish to display custom ranges.
If you wish to use custom breaks, use the ‘breaks’ element to specify break values for each indicator. These must be separated by semicolons and will define the number and size of the ranges shown in the chart. The break values can be different for each indicator but the number of breaks must be the same. If you wish to flip the ranges for a particular indicator, set the ‘breaksFlip’ element to be TRUE.