Configuration
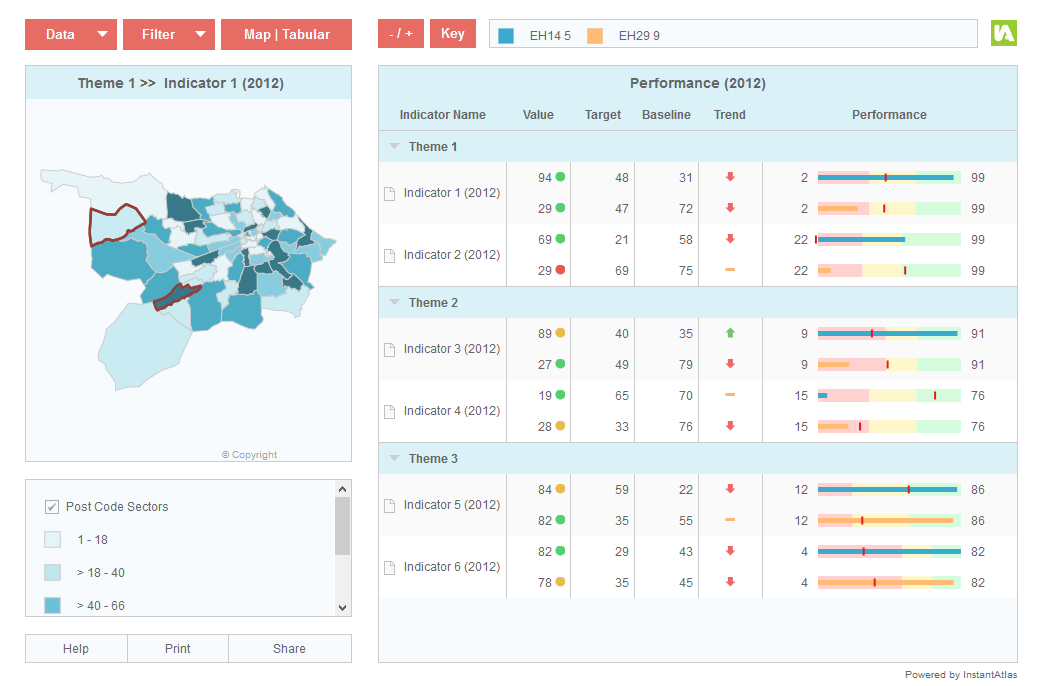
With this configuration the spine chart works slightly differently. Each indicator value is represented using a horizontal bar that is superimposed upon reversible shaded ranges. Each indicator can operate on a different scale in the bars column. This chart is well suited to displaying performance indicators but can also be applied more widely to other data. If you publish this with a demonstration data file the report will look like that in the screen shot below.
Again, you can alter this configuration once you have published a report by opening the config.xml file using the Designer. For example, you might decide to remove the baseline column or to change the symbols that are displayed alongside the indicator values. Please see section ‘Area Profile – Spine Chart’, sub-section ‘Configuration’ for detailed information.
Data Preparation
For each indicator you include in your report you may wish to provide the following associates in the JSON data file(s). These match the default configuration of the chart:
target – target values shown as text in the ‘Target’ column and as vertical bars in the ‘Performance’ column of the chart.
baseline – baseline values shown as text in the ‘Baseline’ column of the chart
trend – values shown as symbols in the ‘Trend’ column of the chart
state – values shown as symbols in the ‘Value’ column of the chart
The suggested data structure is shown in the ‘iadatasheet’ worksheet of the workbook called IAworkbookAreaProfile_Performance.xls. This is also in the ‘workbooks’ folder of your InstantAtlas installation.
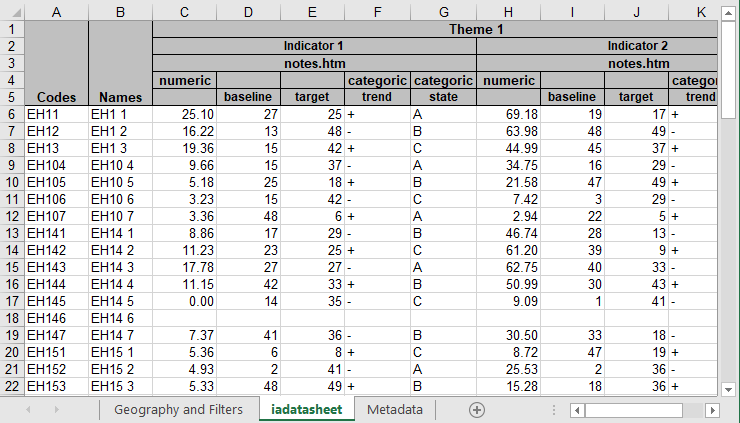
Please note that you do not have to provide each of the mentioned associates, however if you provide less or use different column names you will have to modify the configuration settings in the Designer to match your data.
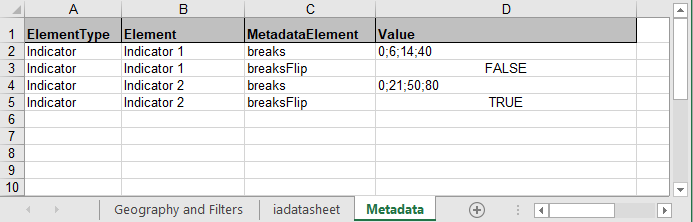
The breaks are calculated automatically for each year for each indicator as quantiles. There is no need to add custom breaks to Metadata unless you wish to display custom ranges.
If you wish to use custom breaks use the ‘breaks’ element to specify break values for each indicator. These must be separated by semicolons and will define the number and size of the ranges shown in the chart. The break values can be different for each indicator but the number of breaks must be the same. If you wish to flip the ranges for a particular indicator, set the ‘breaksFlip’ element to be TRUE.