
Moving and Resizing Components
The canvas allows you to change the position and dimensions of components by clicking and dragging. Simply click on a component to select it and drag it to a new location. Click on one of the resize handles of a component and drag it to change the dimensions of the component.
General Properties
Introduction
The properties in the configuration file are template specific. So the list of properties for a report published using the Single Map template may be different to that for a report published using the Area Profile template.
![]() You can view a description for any property by holding you mouse pointer over its name. If you require further information regarding a property please contact your support provider.
You can view a description for any property by holding you mouse pointer over its name. If you require further information regarding a property please contact your support provider.
To access the general properties for the report, ensure that no components are selected in the interface (simply click on an empty part of the canvas to deselect a selected component or select ![]() ). The general properties of the dynamic report will show in the properties pane in the right side of the window.
). The general properties of the dynamic report will show in the properties pane in the right side of the window.

You can click and drag the dividing line between the two columns to change column width. Hold your mouse pointer over each cell in the ‘Name’ column to view a longer description of the property.
To change a value that can be True or False, simply click the check-box in the ‘Value’ column. Some values are chosen from a pick list – click in the cell and select your value from the pick list. To change a numerical value, click in the cell containing the value. Up/down arrows will appear and you can use these to change the value. Alternatively, you can type a new number into the cell but you must then press ‘Enter’ on your keyboard to register the new value. To change a free text value, double click in the cell containing the value and type a new value.
Configuring the Visible Text in the Report
You can change the text for exporting, sharing and for the legend classifiers in the general properties. Other text can be changed within the specific component properties. This is important to ensure that the InstantAtlas reports can be made multilingual – it must be possible for the person designing the report to change all visible text. Note that not all text is configurable via the Designer though. Theme and indicator names, for example, are read from the JSON data files and must be changed there.
Classification properties
The legend classifications use the “>” symbol to make it clearer which class a value should lie in. The ‘Use Old Classification Method’ is there to allow customers to revert to the old legend style if they wish, which does not use this symbol.
Configuring the Responsive Design of the Report
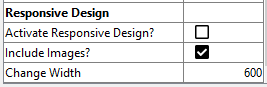
The InstantAtlas dynamic reports offer the ability to enable responsive design, allowing your report to be viewed easily across a wide range of devices (e.g. from desktop computer screens to mobile phone screens). The settings for responsive design are located in the Responsive Design section.

To enable the Responsive Design for the report, tick the ‘Activate Responsive Design?’ box. You can also specify the minimum width of the viewing screen size at which the responsive design starts to respond and set to exclude images as part of the responsive design.
Further in this section: