
All components in the report can either be permanently visible or work as a pop-up window which can be toggled on and off using a button. This section will describe the steps to modify a component to be a pop-up window. The bar chart will be used as an example.
Click to select the bar chart component in the canvas and the ‘Bar Chart Properties’ will be displayed in the right hand panel. As with every other component, the bar chart has the two properties:
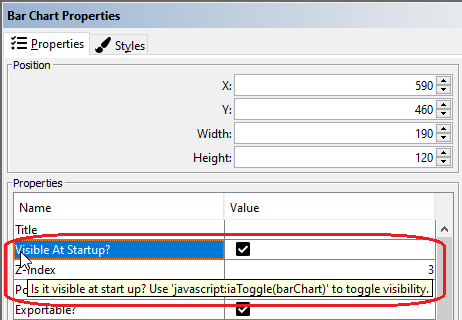
Visible at Startup?
PopUp Window?
Tick the ‘PopUp Window?’ checkbox to make the bar chart a pop-up. Use the ‘Visible At Startup?’ property to define whether the component should be visible or hidden when opening the report. Both properties are part of all report components.

You should then insert a new button into your report. Select ‘Insert’, ‘Button’ from the menu bar, give the button a label and tooltip of your choice and select the ‘Links’ tab in the Properties Pane. Type ‘javascript:iaToggle(barChart)’ into the URL field.

You can find out which script you need to use by hovering over the ‘Visible at Startup?’ or ‘PopUp Window?’ properties. The tooltips that appear include the JavaScript function.
You can find a full list of JavaScript functions in section ‘Button Properties’.