
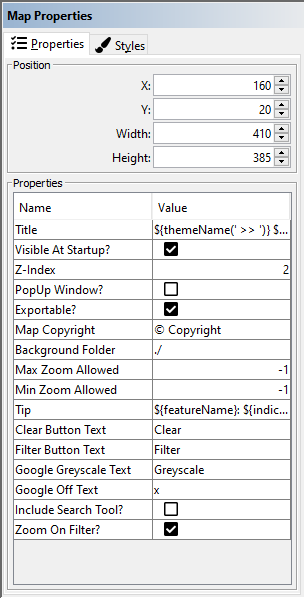
To access the properties for a component, ensure that it is selected in the canvas. The image below shows the properties panel for the map component. Here you can change the selected components settings and values.
See General Properties for details on the properties panel.
Further in this section:
- Button
- Image
- Data Explorer
- Filter Explorer
- Text
- Table
- Map
- Bar Chart
- Time Series Charts
- Area Breakdown – Pie Chart
- Stacked Associates and Stacked Associates – Time Series
- Pyramid Chart
- Radar Chart
- Statistics Box
- Feature Card
- Dimension Explorer