
Data Columns
If you view the properties for a table component, you will see a ‘Data Columns’ section at the bottom. This enables you to add or remove columns from the data table in your report. You can add a column by clicking the ‘Add’ button and remove a column by clicking it in the list to highlight it and clicking the ‘Remove’ button.
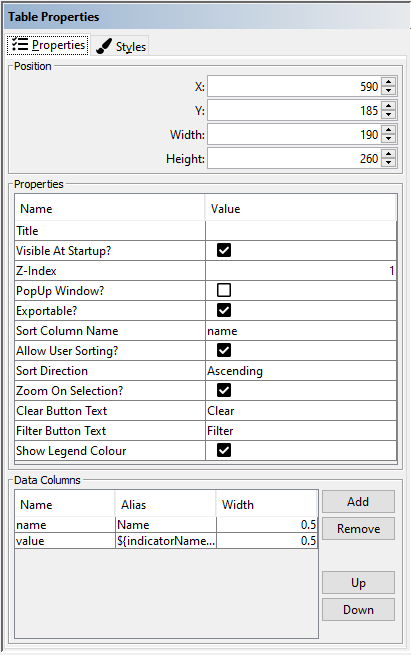
The data table contains two columns by default: the name of the base geography feature (which includes the legend colour symbol and notes icon) and the indicator value. The notes icons can be removed if you delete the respective metadata links in the data (the IA example Excel workbook has ‘notes.htm’ as a default value in column C of the ‘Geography and Filters’ worksheet). There is a setting in the ‘Properties’ section above the ‘Data Columns’ section that allows you to hide the legend colour circles in the table.
Extra columns are typically added in order to display any associate values that you have added to the data files for your report (please refer to section ‘The InstantAtlas Excel Data Manager’, sub-section ‘Entering Associate Values’ for more information on associates). If you have no associate values in the data files for your report, there is no point in adding new columns to the table as there will be nothing to display in these columns. If you do have associate values in your data files, you can add columns to your table to display them. The name value for a column should exactly match the name for the associate values in the data file(s) for the report (except for confidence intervals – see below).
For example, the image below shows an Excel workbook with two sets of associate values for Indicator 1, the names of which are given in cells D5 and E5. If you add these columns to the data table in order to display these associate values, the name values in the Designer for the columns would have to be ‘count’ and ‘rank’ (i.e. exactly match the contents of cells D5 and E5). The alias value is displayed as the column heading in the report data table – you can enter any text you like for the alias.
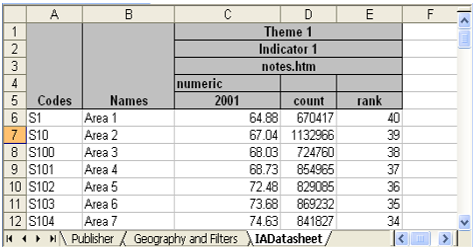
Confidence intervals are a special case. These are called ‘ll’ and ‘ul’ in the data files for dynamic reports. In the Designer, however, these columns must be given name values of ‘lowerLimit’ and ‘upperLimit’.
Other important table properties are:
Exportable?
If this box is ticked you will see an export button in the top right hand corner of the table when you hover with the mouse over it. Clicking this button will open a pop-up window in which you will be able to copy and paste the data in a comma delimited CSV format.
Zoom On Selection?
If this box is ticked the map will zoom to the feature which gets selected in the data table.
Show Legend Colour?
If you do not wish to see circles with the legend colour of each feature in the table you can untick this checkbox.