
This worksheet lists the geographic features you have data for and any links and filters you care to define. All of the geographic features in the base geography of your report must appear in this worksheet. Remember that the base geography is the set of geographic features that you wish to produce a thematic map for. For example, if you have crime statistics for community districts in New York and you wish to make a thematic map of these, the base geography for your report will be New York community districts.
For each base geography feature you can optionally supply filter information. In InstantAtlas reports, a filter menu allows you to apply filters to the data displayed.
You have the option to include comparison geographies in this worksheet. Comparison geographies are displayed in a separate table in an InstantAtlas report. For example, if your base geography is New York community districts, your comparison geographies might be New York City and the USA. This would enable you to compare data for individual community districts to the city and national averages.
For each geographic feature you enter the following:
1. A unique code (column A)
2. A name (column B)
3. A link to an external file (column C) – optional
4. Filter information (columns D onwards) – optional
The ‘Geography and Filters’ worksheet is permanently active. It should not be renamed.
Entering Codes (Column A)
The type of the digital map file used as the base geography for a report is defined in cell A1. Digital map files can be one of the following geometry types: polygon, line or point.
For example, if you publish a report with the boundaries of New York community districts (i.e. polygons) as your base geography, cell A1 should contain ‘polygon’. If you publish a report with the Canadian rail network (i.e. lines) as the base geography, cell A1 should contain ‘line’. If you publish a report with Scottish cities (i.e. points) as your base geography, cell A1 should contain ‘point’.
From row 3 down, column A should contain codes for the geographic features in a report. It is essential that you populate column A with the correct codes. These must be exactly the same codes used to identify features in the digital map files published in your report. If you type in arbitrary codes that do not exist in your digital map files, your dynamic report will not be able to match data values to geographic features.
Because the codes in your Excel workbook must be the same as those in your map files, the same rules apply:
1. Codes must be unique (i.e. no code is repeated)
2. Codes must not include spaces
3. Every geographic feature must have a code
If you do not know what codes are used to identify features in your map files you can do the following:
1. Start the InstantAtlas Publisher
2. Publish a report with the desired base geography and contextual geographies
3. Click the ‘Unpack’ button on the final screen of the Publisher
4. Browse to the output folder for the report you published and open the file called ‘geographies.csv’ using Excel
5. The codes in your map file will be listed in the first column of ‘geographies.csv’.
6. Copy and paste the codes from ‘geographies.csv’ into your ‘Geographies and Filters’ worksheet
Make sure that Excel does not automatically remove leading zeros from your codes – you can avoid this by typing a single quote before the code (this forces Excel to treat the code as text even if it consists of numbers).
If you wish to include comparison geographies you must enter their codes below those of the base geography features. The codes must be given the prefix # (e.g. #TA1 or #00AB) to distinguish them from base geography features. In the example provided, there are two comparison geographies: the City of Edinburgh and Scotland.
Please note that the number and order of areas in the Geography and Filters worksheet must be consistent with the number and order of those in your iadatasheet(s).
Entering Names (Column B)
Check that cell B2 contains the name of your base geography. You can type any text here apart from a forward or back slash (/ or \). For example, if you publish a report for post code sectors, you could enter ‘post code sectors’ in cell B2. This text is used in the naming of the JSON data files and will not be displayed in the report itself unless you are creating multiple geography reports.
From row 3 down, column B should contain names for the geographic features. These are the feature names that will be displayed in the report. In the example provided, the names are similar to the codes but include spaces.
Entering Links (Column C)
For each base geography feature, you can optionally specify a link to any file. This is the file that will open if the notes icon next to a geographic feature is clicked in the data table of an InstantAtlas report. Typically these are used to link to files containing geography-related metadata. If your data does not contain a link in column 3 of the Geography and Filters worksheet for a certain geographic feature, no notes icon will appear in front of the name of this feature.
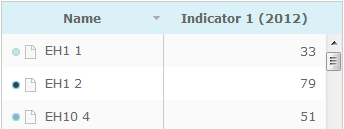
So you can provide a link to geography metadata on a feature by feature basis.
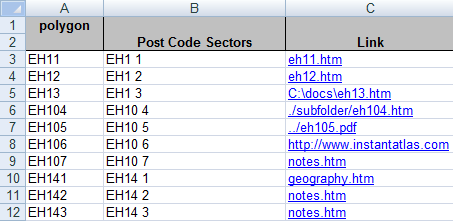
In the example workbook, the link ‘notes.htm’ is provided for each feature. This means that when the notes icon is clicked for any feature, a file called ‘notes.htm’ located in the report folder will open. You can use absolute pathnames (e.g. ‘C:\notes.htm’) or relative pathnames (e.g. ‘../../notes.htm’). If you intend to move your report folder it is best to put all external files you wish to link to into the report folder and specify relative pathnames to them in column C.
With relative pathnames, ‘./notes.htm’ means that ‘notes.htm’ is located in the report folder whereas ‘../notes.htm’ means that ‘notes.htm’ is located in the parent folder. And ‘../../notes.htm’ means that ‘notes.htm’ is located two levels above the report folder.
The following image illustrates some examples of links that could be entered using absolute and relative pathnames.
Entering Filter Information (Columns D Onwards)
By making entries in columns D onwards, you are able to define filters for your report. Row 1 should contain ‘filter’. The entry in row 2 should be the name of the filter group. Any text you enter in a filter column becomes a value within that filter group. When you click a filter value under the Filter menu of your report, only geographic features with that filter value will be displayed.
![]() It is possible to filter the map using multiple combined filter values. Please see Filter Type.
It is possible to filter the map using multiple combined filter values. Please see Filter Type.
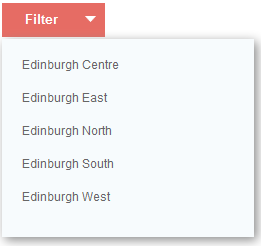
In the example Excel workbook provided, there is one filter group called ‘Zones’. It has five values: Edinburgh Centre, North, South, East and West. This would give you a filter in the report looking like that shown in the following image. Clicking ‘Edinburgh West’, for example, would result in only post code sectors in Edinburgh West being displayed in the report.
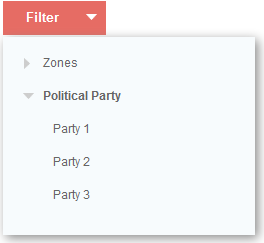
You can have multiple filter groups in a report. For example you might add a second filter column designed to group post code sectors with the same political affiliation.
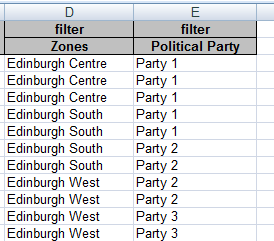
This would give you a filter menu in the report with two filters.
You can add as many filters as you wish. Filters can be geographic or non-geographic.
It is possible to assign multiple filter values to the same geographic feature. This is done by entering the filter values separated by a semicolon (please ensure there is no space character after the semicolon):
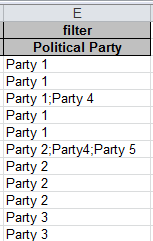
The filter values ‘Party 4’ and ‘Party 5’ will appear as separate filter options in the filter explorer.
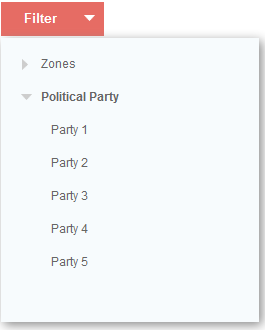
The geography features with multiple filter values will be visible in the map when either of the assigned filter values is selected by the end user.