
The Standard Bubble Plot is a predefined configuration of the Scatter Plot template which is not to be confused with the Advanced Bubble Plot template. using this configuration, the end-users are only required to select a single indicator, the indicator shown in the map. The position and size of bubbles shown in the chart are pre-defined by the administrator and cannot be changed independently. This gives the end-user less freedom but makes the report easier to use.
If you publish this configuration with a demonstration data file the report will look like that in the screen shot below.
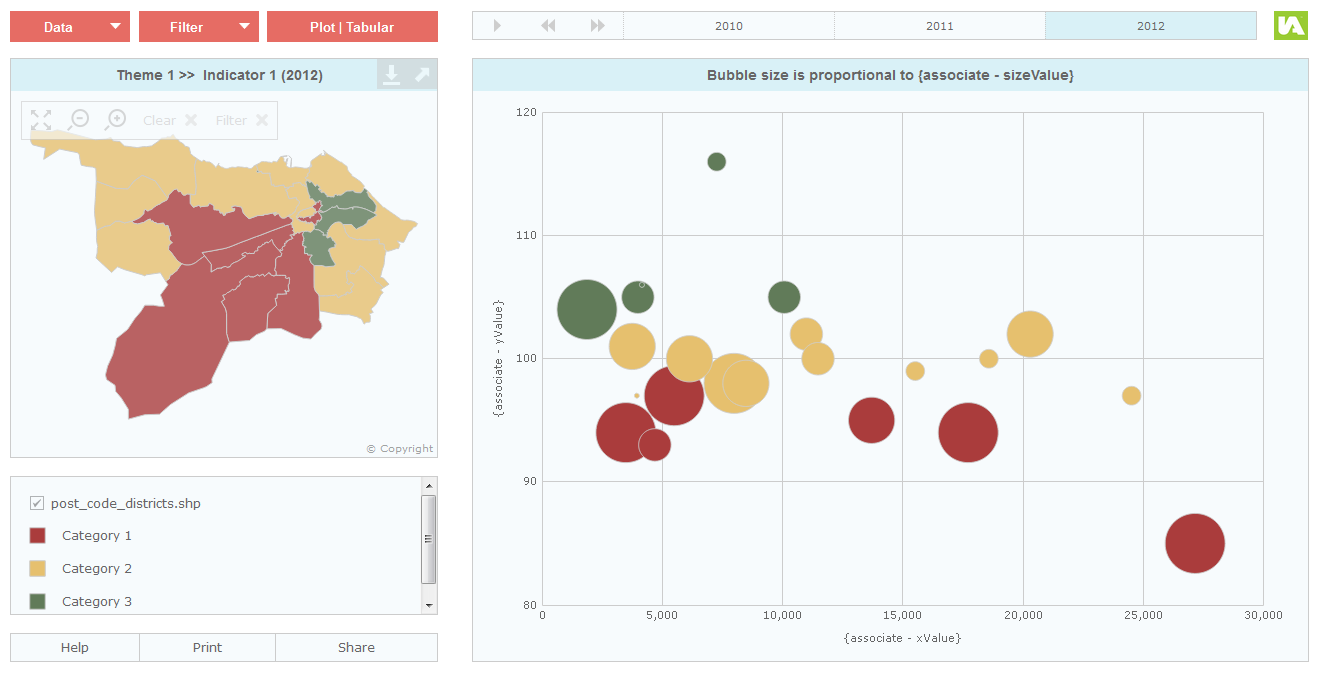
There is only one ‘Data’ button for changing the indicator in the map – the bubbles will change position and size automatically.
While this configuration is simple from the end-user point of view, it is more involved from the point of view of the person creating the report. This is because for each indicator you must supply a minimum of two associates in the data file(s):
xValue – the X axis values for the bubbles
yValue – the Y axis values for the bubbles
You will also have to supply a third associate if you wish the bubbles to have different sizes:
sizeValue – the values that will control the radius of the bubbles
These associate names are defined in the configuration file of the report. It is possible to use different associate names by editing the properties of the Bubble Plot component using the Designer. However, as these associate names are not displayed in the report this is usually not necessary.
When using this configuration you may want to define certain minimum and maximum axes values for the bubble plot component. This is done in the Metadata settings of your Data Manager (Excel or Access) and can be defined on an indicator or theme basis. Please see section ‘Adding Indicator Display Metadata’ for detailed information on how to define metadata settings. The MetadataElement commands required are as follows:
minChartValueX – sets the minimum X axis value of the Bubble Plot component
maxChartValueX – sets the maximum X axis value of the Bubble Plot component
minChartValueY – sets the minimum Y axis value of the Bubble Plot component
maxChartValueY – sets the maximum Y axis value of the Bubble Plot component
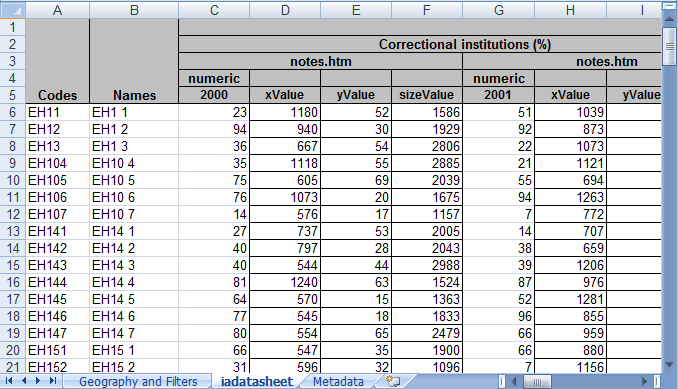
An example of how you should prepare your data is provided in the Excel workbook called IAworkbookBubblePlot_Simple.xls.
This is located in the ‘workbooks’ folder of your InstantAtlas software. The default location for this is:
C:\Program Files\EsriUK\InstantAtlas\workbooks.
You can see that each indicator date is accompanied by the three associates listed above.
You can specify the labels that will appear on the X and Y axes by using the Designer to open the report’s configuration file and editing the properties of the Bubble Plot component.