
This step of the publishing process involves specifying editable settings for your dynamic report. The language that the properties appear in will depend upon the language you chose to publish your report in. You can click and drag the divider between the ‘Property’ and ‘Value’ column headings to change the width of the columns. An example of the ‘Standard’ settings can be seen in the image below.
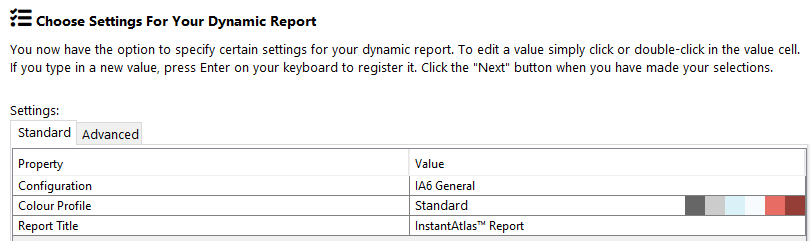
Some values are free text and some can be selected from a pick list. To edit a value, simply click in the cell containing it. For text values, double click in the cell, delete the existing value and type a new one. Then press the ‘Enter’ button on your keyboard to register the new value.
You do not necessarily have to edit every value. The table below lists the properties of the ‘Standard’ and ‘Advanced’ tabs with a description for each.
| Property | Description |
| Configuration | The configuration option allows you to choose the default design and layout from those that are available. Once the dynamic report has been published, the design and layout can be changed even further using the Designer. |
| Colour Profile | The colour profile allows you to choose a default colour scheme for the dynamic report. Once the dynamic report has been published, the colour scheme can be changed even further using the Designer or Style Editor. |
| Report Title | The title of your report as viewable in the title screen of your browser when the report is opened. |
| Report Keywords | During publishing, these keywords will be saved as a meta tag in the atlas.hml file. They are helpful if you want your report to be found by search engines. Ideally you would provide 3-4 keywords about the topic of your report. |
| Report Description | During publishing, this description will be saved as a meta tag in the atlas.hml file. It is helpful if you want your report to be found by search engines. Ideally you would provide a description about the topic of your report with approx. 155 characters. |
| Map Margin | The greater the value, the greater the amount of empty space that surrounds your base geography in the map(s) of your report. If the base geography for your report is a point map file, it is typical to add a map margin for improved display. |