
Contents
Data
Similar to the map component you can also set the bar chart to display values from a column other than the indicator column. To do this, type in the name of the associate column into the property ‘Data’ in the Bar Chart Properties.
X-Axis Label and Y-Axis Label
If you wish to show labels along the X and Y-Axis you can also define this in the Bar Chart Properties.
Confidence limits
By default, if you wish to show confidence limits in the Bar Chart component, you will need to add two columns called ‘ll’ and ‘ul’ to your workbook for any indicators you wish to show confidence limits for (see ‘Entering Associate Values’ in sub-section ‘The Datasheets’ of The InstantAtlas Excel Data Manager). However if you have associate columns with different names that you wish to use for the error bars, you can specify these by entereing their names into the ‘Upper Limit Data’ and ‘Lower Limit Data’ properties.
Tip
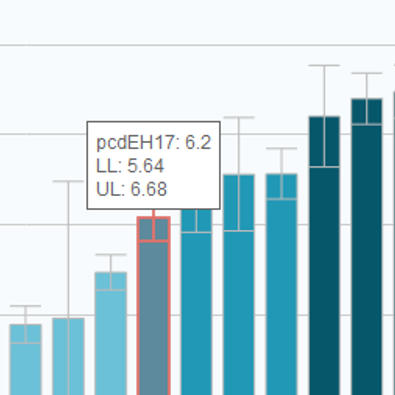
This property contains the code for the tooltip you see when you hover over the bars. By default this code looks like this:
${featureName}: ${indicatorValue}
${notEmpty(lowerLimit, ‘<br/>LL: ‘)}${lowerLimit}
${notEmpty(upperLimit, ‘<br/>UL: ‘)}${upperLimit}
This code means that the first line of the tooltip is the feature name and the indicator value of the hovered bar. In case that your data contains confidence intervals, two further paragraphs will be added. Both new lines begin with a static text (‘LL: ’ for lower limit and ‘UL: ’ for upper limit) followed by the respective dynamic variable.
You can modify this code or add any other static text, substitution variables or HTML tags. Please refer to the ‘Tip’ section of the Map Properties for further information and examples.
Exportable?
If this box is ticked you will see an export button in the top right hand corner of the bar chart when you hover it with the mouse. Clicking this button will open the bar chart graphic as an image in a pop-up window. From there you can save the image through the right-click menu.
Orientation
You can set the orientation of the bar chart to be vertical or horizontal.
Match Axis to Data?
By default the data axis of the bar chart will show values rounded to the next logical interval. If you tick this property the minimum and maximum value of the data axis will be the same as the minimum and maximum value of the selected indicator/time period.
Use Fixed Values?, Fixed Minimum Value and Fixed Maximum Value
You can define fixed minimum and maximum values for the bar chart – however these settings will apply to the whole report. If you wish to define fixed values on a theme, indicator or time period basis you should do it through the Metadata of your data files. Please refer to section ‘Setting the Chart Axis Minimum and Maximum’.