
The Pyramid Chart is only available in the dedicated Population Pyramid (HTML Edition) Template (licenced together with the Single Map template).
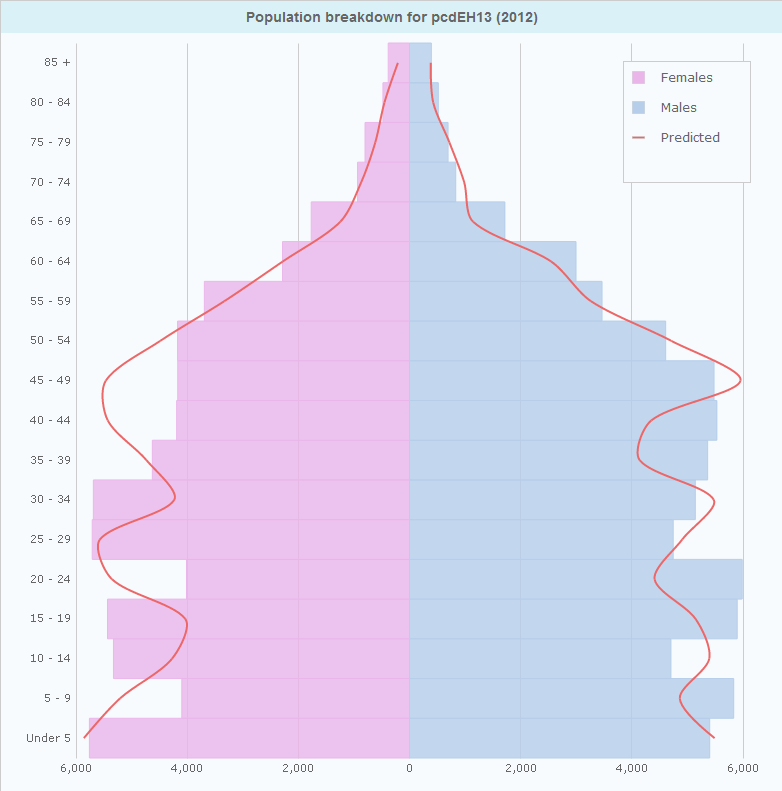
The Pyramid Chart displays indicator data belonging to one map feature in a back-to-back horizontal bar chart. This chart is typically used to show population structure broken down by age groups and gender.
![]() Please refer to the Pyramid Chart support article for an explanation of some of the configuration properties.
Please refer to the Pyramid Chart support article for an explanation of some of the configuration properties.