
Release Overview
InstantAtlas Desktop 6.10.0 is focused on supporting modern, accessible technologies. Development for the Flash templates and the HTML Profile template ceases at this release and these templates have been removed from the download bundle. If you still use these templates, please contact Support who can supply them individually. The Excel Data Manager now supports export of data to InstantAtlas cloud service apps Report Builder and Dashboard Builder. There are enhancements to the HTML Templates, some changes to the InstantAtlas Desktop Tools and bug fixes.
Key Enhancements
Enhancements to the HTML Edition Templates
Ability to show comparisons as columns and targets in the Area Profile component
If you wish to show a national or regional average in an area profile component, either as a column or a target symbol, you can now do this without having to repeat the values for each geography in an associate column. Instead you can add the data as a comparison area and use the code of the comparison area (without the # character) to reference it in the Designer. In the example below the comparison area for Scotland with the code ‘Scot’ has been added as both a column and target symbol in the Spine chart:
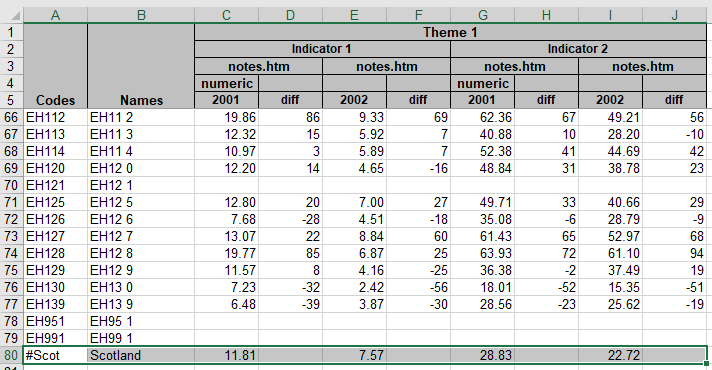
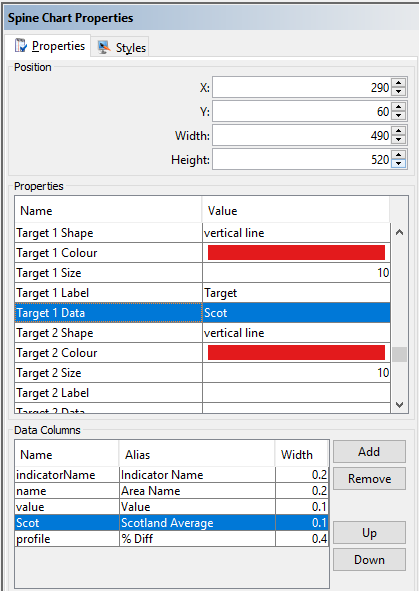
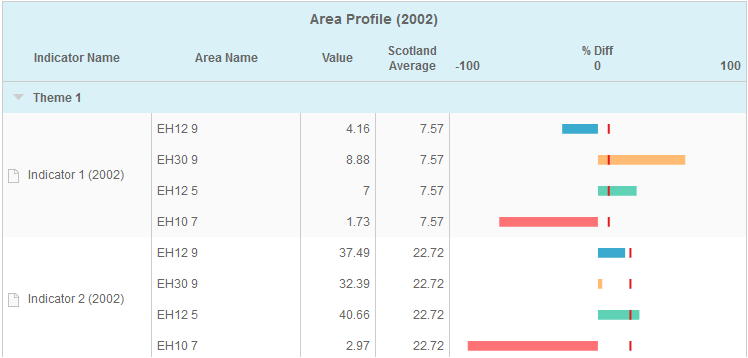
The resulting report looks like this:
The Dropdown Explorer can now merge data across geographies
The Dropdown Explorer has gained a configuration property called ‘Merge Data Across Geographies?’. When ticked, a new geography dropdown list is added to the widget, listing the geographies available for the selected indicator. The ‘Date’ dropdown will not be shown.

Calculating significance values for Health Profile reports
A report published using the Health Profile configuration of the Area Profile template can now automatically calculate statistical significance for proportions if the numerators and denominators are provided. The calculated values ‘Low (0.001)’, ‘Low (0.025)’, ‘None’, ‘High (0.025)’ and ‘High (0.001)’ can then be assigned to symbols to be displayed in the health profile. It is still possible to provide your own pre-calculated significance values as associate data if you prefer.
Calculating the funnel lines in Funnel Plot reports
Reports can now automatically generate the control limits shown in the funnel plot. By default, the Funnel Plot configuration file now expects two associate columns called ‘numerator’ and ‘denominator’. If the report cannot find coordinates for the funnel lines in the data file (in the metadata), it will automatically calculate the 2 and 3 standard deviation lines as well as the average line from the numerator and denominator values. If you wish to show different control limits you can still provide the coordinate arrays in the metadata as before.
Further enhancements
- Added ability to hide the notes button in the data explorer and area profile widgets even if notes links are defined in the data properties
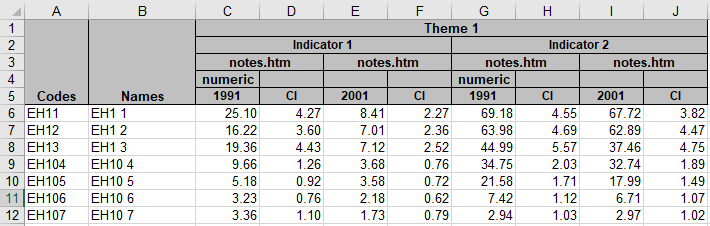
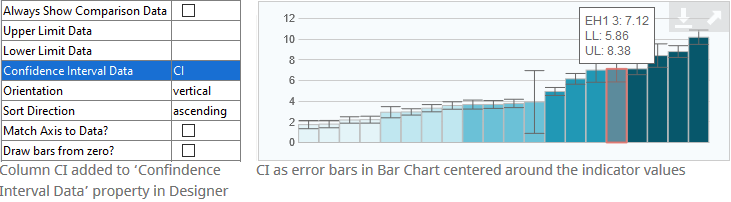
- Added ability to specify what associates to use for upper and lower limits in the bar chart
- Added ability to provide a confidence limit column for the bar chart that is then used to draw error bars centred on the bar value:

Associate Column called CI in Excel
Enhancement to the Excel Data Manager
The Excel Data Manager add-in now contains a new button called IA Export for RB+.
![]()
This function can be helpful for those customers, who are using the InstantAtlas cloud service apps Dashboard Builder or Report Builder and already have their data in an Excel workbook correctly formatted for InstantAtlas Desktop. Please refer to the following help pages for further information:
- Tips & Tricks for InstantAtlas Desktop users using Dashboard Builder
- Using data from an InstantAtlas Desktop Excel workbook in Report Builder
Enhancement to the Publisher
As the Flash templates and HTML Profile templates have been removed, there is no longer any need to upload a data.xml file into the Publisher. The ‘Choose Your Data’ step, which allowed you to upload this file, has therefore been removed to simplify the publishing process.
Key Bug Fixes
Bug Fixes to the HTML Edition Templates
- In the time series chart the ‘List Of Dates To Ignore’ is now also applied to comparison features. In previous versions, comparison trend lines would still show the hidden dates. Here the green line is a comparison feature. Data for 2011 has been set to be hidden:
Now the chart also hides the 2011 data for the comparison trend line:
- It is again possible to export the legend component as an image, even if it has a title bar.
- The selected indicator is now being preserved when changing the base geography and using the Dimensions Explorer.
- URL parameters to select an indicator on start-up are now being applied correctly when using the Dimensions Explorer.
- The default tooltip of the Time Series Chart 2 in Double Map, Double Map Time Series and Double Base Layer reports is now showing the correct indicator value of the second data group.
- A tooltip now shows when hovering over the bars of an Area Breakdown Bar Chart with associates. The tooltip property in the Designer needs to be changed to ‘${associate-name} ${associate-value}’.
- Several fixes to both numeric and categoric legend classifications.

Bug Fix to the Publisher
When using Google Maps as a background layer, the API key entered into the Publisher is once more being transferred to the published report.
Bug Fix to the Access Data Manager
The Access Data Manager no longer mixes up comparison values when exporting data with multiple comparison features.
Versioning
Please find below a list with the current version numbers of all InstantAtlas Desktop software parts. A star indicates the parts that have been updated in this release:
| Installer | 6.10.0 * |
|---|---|
| Publisher / Designer / Style Editor | 6.10.0 * |
| HTML Templates | 6.10.0 * |
| Excel Data Manager | 6.10.0 * |
| Access Data Manager | 6.10.0 * |
Upgrading to 6.10.0 (applies to customers only)
![]()
- Access the Resource Library by logging in to InstantAtlas Online at https://online.instantatlas.com/customers/resource-library
- If you have not already registered for an account, you should click the New User option.
- Download the installer file (.exe) from the Desktop Maintenance area to the computer(s) with your current InstantAtlas installation(s).
- Double-click the file to run the installer. Choose a language for the installation. The standard installation is recommended for most users. The advanced installation essentially allows you to install additional language features (French, German and Spanish).
![]()
- Navigieren Sie zu https://online.instantatlas.com/customers/resource-library um sich bei der InstantAtlas Ressourcensammlung einzuloggen.
- Falls Sie sich noch nicht registriert haben, sollten Sie auf den Link „New User“ klicken.
- Laden Sie die Installationsdatei (.exe) aus dem Maintenance-Bereich herunter und speichern Sie diese auf dem Computer auf dem derzeit InstantAtlas installiert ist.
- Starten Sie die Datei mit einem Doppelklick. Wählen Sie eine Sprache für die Installation aus. Für die meisten Benutzer wird empfohlen, die Standardinstallation durchzuführen. Die erweiterte Installation ermöglicht Ihnen hauptsächlich, weitere Sprachmodule (Französisch und Spanisch) zu installieren.
![]()
- Navige a https://online.instantatlas.com/customers/resource-library para entrar en su cuenta Biblioteca de Recursos InstantAtlas
- Si no tiene una cuenta Biblioteca de Recursos, haga clic en la opción New User.
- Descargue el fichero de instalación (.exe) en el ordenador(es) con su instalación(es) actual de
- Haga clic-doble en el fichero de instalación. La instalación estándar conviene a la mayoría de los usuarios. La instalación avanzada sobre todo permite la instalación de otros idiomas (francés o alemán).
Compatibility Notes
Compatibility Between Reports of the Same HTML Template but Different Versions
You may wish to publish a version 6.10.0 dynamic report to benefit from the enhancements/bug fixes but retain the data and custom design that you created for an older HTML report. Of the files that contain the data/design, some can be safely copied over from an older report while others cannot. The table in the sections below show which files can safely be copied into a version 6.10.0 report.
| File | Notes |
|---|---|
| Data files (data.js and supporting theme files) | Yes, can be copied to a v6.10.0 report |
| Stylesheet (default.css) | Yes, can be copied to a v6.10.0 report. Note that the old stylesheet will not contain new settings which were introduced in newer versions.1 |
| Configuration file (config.xml) | Yes, can be copied to a v6.10.0 report. Note that the old configuration file will not contain new settings or components which were introduced in newer versions. If you wish to make use of these, please use the Configuration File Converter within the Resource Library to update your old config.xml file. |
1 If you are using map labels and your old stylesheet is of version 6.6.0 or 6.6.1 you will not be able to copy it into a 6.10.0 report as the labels may not appear as expected.