
Release Overview
InstantAtlas Desktop 6.7.4 is predominantly focused on enhancements and bug fixes to the HTML5 templates. There are some changes to the Publisher and Excel Data Manager tools though no changes to the Flash templates.
Key Enhancements
Web-based Documentation
The InstantAtlas Desktop User Guide as well as the Getting Started Guide in English and German are now available as HTML Versions (Spanish soon to follow). This allows us to easily update the documentation online, even between software releases. The links from the InstantAtlas folder in your Windows Start Menu will always link to the most recent version. We are aiming to transfer all our PDF documentation to HTML in the coming months.
Enhancements to the HTML Edition Templates
Improved Chart Names
Over the last few versions we have added a number of new charts to our HTML Templates. To ensure a logical and consistent naming convention of all charts and associated legends across all InstantAtlas products, we have decided to rename some of the existing components. Here are the changes:
![]()
| Old Name | New Name |
|---|---|
| Time Series Chart | Time Series – Line Chart |
| Discrete Time Series Chart | Time Series – Bar Chart |
| Stacked Time Series Chart | Stacked Associates – Time Series |
| Stacked Time Series Legend | Stacked Associates – Legend |
![]()
| Vorheriger Name | Neuer Name |
|---|---|
| Zeitseriendiagramm | Zeitreihe – Liniendiagramm |
| Diskontinuierliches Zeitseriendiagramm | Zeitreihe – Säulendiagramm |
| Gestapeltes Zeitseriendiagramm | Gestapelte Assoziierte – Zeitreihe |
| Legende des Gestapelten Zeitseriendiagramms | Legende für gestapelte Assozierte |
![]()
| Spanish Old Name | Spanish New Name |
|---|---|
| Gráfico De Series De Tiempo | Series De Tiempo – Gráfico De Líneas |
| Gráfico De Series De Tiempo – Barras | Series De Tiempo – Gráfico De Barras |
| Gráfico Apilado Series De Tiempo | Asociados Apilados – Series De Tiempo |
| Leyenda Gráfico Apilado Series De Tiempo | Asociados Apilados – Leyenda |
New Component: Radar Chart
The Radar Chart displays data for multiple indicators and themes plotted onto a “radar” of several circles. Low values are displayed near the centre of the radar and high values near the edge. The shape created by the lines that connect the plotted indicator values in the chart allows you to visualise how an area scores across a range of indicators and how this area compares to others.
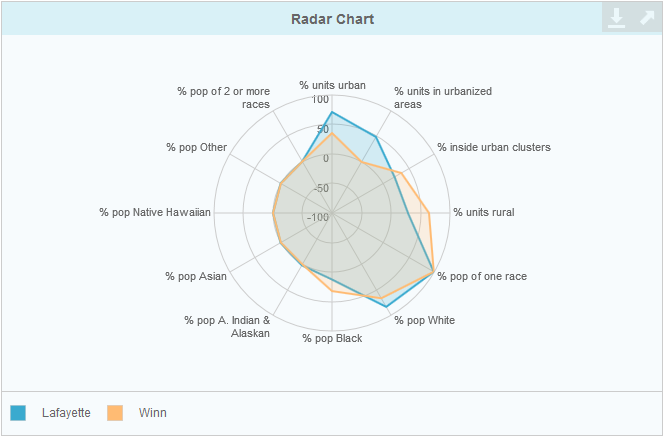
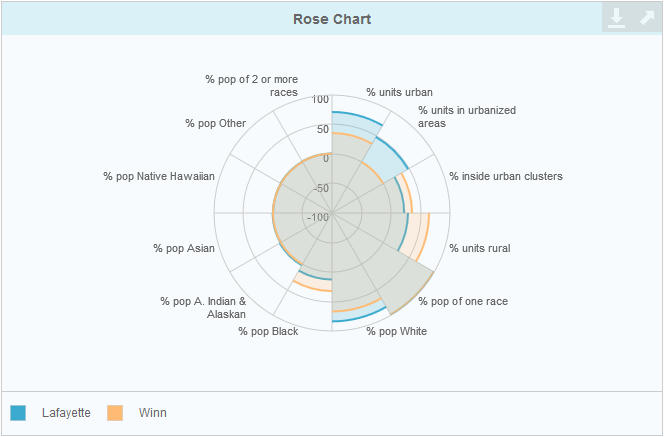
The Rose Chart is a variant of the Radar Chart, where indicator data is plotted as arc of circle instead of a shape’s vertices. The chart type can be selected in the Designer.
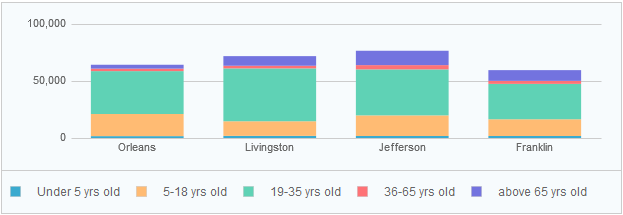
New Component: Time Series – Stacked Chart
This chart is a variant of the Time Series – Bar Chart (formerly ‘Discrete Time Series Chart’). It shows the indicator of multiple selected features as stacked bars. The assigned colour for each selected feature can be seen in the Selected Features Legend.
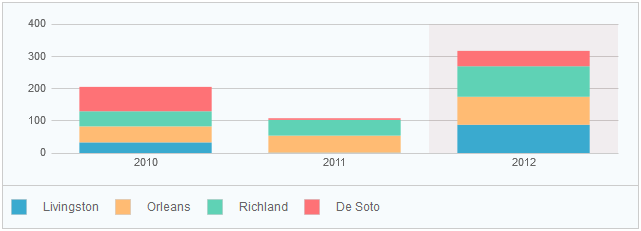
New Component: Stacked Associates
This new chart shows associates of the current indicator in stacked bars, one bar for each selected feature. It is using the ‘Stacked Associates – Legend’ to display, which colour belongs to which associate.
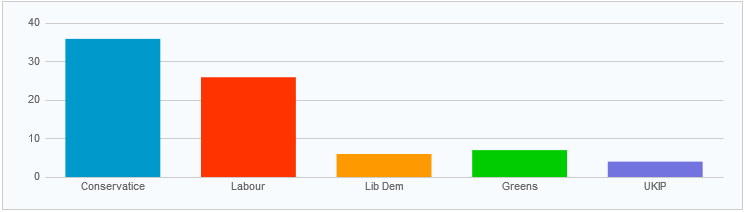
Area Breakdown Bar Chart can be coloured according to categories
The Area Breakdown Bar Chart shows indicator or associate data for each selected map feature. The recently added “Color Bars By Category?” option now allows the definition of an indicator-specific color scheme, that can be used for instance to map election results.
Multiple associates in Time Series – Line Chart
The Time Series – Line Chart shows change in indicator values over time. With the new “Show Associate Data” property it is also possible to include associate values as additional lines in the chart.


Responsive Design
The Responsive Design option allows reports to automatically adjust when viewed on smaller screens like smart phones or tablets. The alternative design will be activated on a administrator defined screen width and will re-arrange components underneath each other.
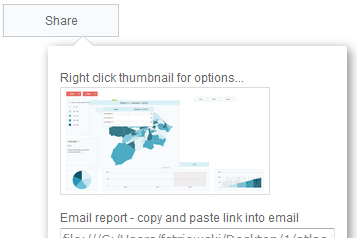
Export full atlas as image
To export a full atlas as image users had to rely on screen grabs in the past. The “Share” button of the Menu Bar will now display a thumbnail of a full image, that can be saved through the right click menu.
Further Enhancements to the HTML-Templates
- The Feature Card is now included in all default template configurations
- Table columns for associates only appear in the table if the selected indicator has an associate column of that name. E.g. if you define a table column for an associate called ‘count’ then this column will only appear for those indicators that have a ‘count’ associate. For all other indicators the column will be hidden.
- When a comparison feature is highlighted or selected in the comparison table, a corresponding contextual layer feature will highlight. For this to work, the ID of the contextual layer feature needs to match the ID of the comparison feature (excluding the ‘#’).
- The HTML templates now support OpenStreetMap and ArcGIS tiled maps as a background layers.
- Exporting single atlas components now works through a pop-up rather than a new browser tab
- On touch screen devices the pinch navigation now zooms into the centre of the pinch rather than the centre of the map.
Enhancement to the Publisher
Support for OpenStreetMap
It is now possible to include OpenStreetMap as a background layer to your dynamic report. To do this, simply select the ‘OpenStreetMap’ option from the ‘Add’ menu of the ‘Choose Your Background Images’ step in the Publisher. To add OpenStreetMap to your atlas, select it from the URL drop-down list. Other ArcGIS tiled map layers may also work.
Enhancements to the Excel Data Manager
The Excel Data Manager add-in now has a third button labelled ‘IA Create IA Online File’. Users of InstantAtlas Online can export their Excel workbook to upload and use it within the Dashboard Builder and Profile Builder Apps. To learn more about IA Online click here. The JSON options are now the default settings both for exporting as well as for merging data files. This enables you to export the data for your HTML dynamic reports with even fewer clicks.
Key Bug Fixes
Bug Fixes to the HTML Edition Templates
- Categoric associate values that only include numbers will now be shown with thousand separators.
- Tooltips for charts are displayed in the correct position for scrollable pages.
- Google Maps background maps can be loaded over both http and https. This will also align the map toolbar to be in line with Google’s toolbar position.
- Maximizing the map after zooming out will no longer break the report.
- Different categoric values in numeric indicators will no longer get assigned the same legend class.
- Numeric associate data can now be displayed alongside of categoric indicators in Time Series Charts.
- Eliminated unwanted delays in displaying a Time Series – Stacked Chart by Time Animation. The animation will now include all indicator values.
Bug Fixes to the Publisher
- Temporary report copies created by the Publisher will now be deleted when closing the application. Older copies can be removed manually by deleting atlas-…..zip files located at C:\Users\ <user name> \AppData\Roaming.
Versioning
Please find below a list with the version numbers of the software parts in this release. A star indicates the parts that have been updated in this release:
| Installer | 6.7.4 * |
|---|---|
| Publisher | 6.7.4 * |
| Designer | 6.7.4 * |
| Style Editor | 6.7.4 * |
| HTML Templates | 6.7.4 * |
| Flash Templates | 6.7.1 |
| HTML Profile Template | 6.5.0 |
| Excel Data Manager | 6.7.4 * |
| Access Data Manager | 6.7.1 |
Upgrading to 6.7.4 (applies to customers only)
![]()
- Login to the Resource Library by logging in to InstantAtlas Online at https://online.instantatlas.com/customers/resource-library
- If you have not already registered for an account you should click the New User option.
- Download the installer file (.exe) from the Desktop Maintenance area to the computer(s) with your current InstantAtlas installation(s).
- Double-click the file to run the installer. Choose a language for the installation. The standard installation is recommended for most users. The advanced installation essentially allows you to install additional language features (French, German and Spanish).
- IAD 6.7.4 installs an updated Excel Data Manager add-in. If you are upgrading from Version 6.7.1 or higher this should automatically replace the old add-in and you don’t have to do anything. If you are upgrading from a version prior to 6.7.1 you will need to go into the Excel options to activate it. Please refer to section ‘The Excel Add-in’ in the InstantAtlas Desktop User Guide if you do not know how to do this.
![]()
- Navigieren Sie zu https://online.instantatlas.com/customers/resource-library um sich bei der InstantAtlas Ressourcensammlung einzuloggen
- Falls Sie sich noch nicht registriert haben, sollten Sie auf den Link „New User“ klicken.
- Laden Sie die Installationsdatei (.exe) aus dem Maintenance-Bereich herunter und speichern Sie diese auf dem Computer auf dem derzeit InstantAtlas installiert ist.
- Starten Sie die Datei mit einem Doppelklick. Wählen Sie eine Sprache für die Installation aus. Für die meisten Benutzer wird empfohlen, die Standardinstallation durchzuführen. Die erweitere Installation ermöglicht Ihnen hauptsächlich, weitere Sprachmodule (Französisch und Spanisch) zu installieren.
- IAD 6.7.4 installiert ein aktualisiertes Excel Datenmanager Add-in, Falls Sie Version 6.7.4 über Version 6.7.1 oder höher drüber installieren, so sollte das alte Add-in automatisch ersetzt werden und Sie müssen nichts weiter tun. Wenn Sie InstantAtlas jedoch von einer Version vor 6.7.1 aufrüsten, so werden Sie das Excel Datenmanager Add-in in den Excel Optionen aktivieren müssen. Falls Sie nicht wissen, wie das geht, beziehen Sie sich bitte auf das Kapitel “The Excel Add-in” im InstantAtlas Desktop Benutzerhandbuch (englisch).
![]()
- Navige a https://online.instantatlas.com/customers/resource-library para entrar en su cuenta Biblioteca de Recursos InstantAtlas
- Si no tiene una cuenta Biblioteca de Recursos, haga clic en la opción New User.
- Descargue el fichero de instalación (.exe) en el ordenador(es) con su instalación(es) actual de
- Haga clic-doble en el fichero de instalación. La instalación estándar conviene a la mayoría de los usuarios. La instalación avanzada sobre todo permite la instalación de otros idiomas (francés o alemán).
- IAD 6.7.4 instala un nuevo complemento Excel Data Manager . Si esta actualizando la versión 6.7.1 o superior de InstantAtlas, el nuevo complemento debe sustituir automáticamente al antiguo. Si esta actualizando una versión anterior al 6.7.1, utilize las opciones de Excel para instalarlo. Vea el capitulo “The Excel Add-in” del guía InstantAtlas Desktop User Guide (en Inglés).
Compatibility Notes
Compatibility Between Reports of the Same HTML Template but Different Versions
You may wish to publish a version 6.7.4 HTML dynamic report to benefit from the enhancements/bug fixes but retain the data and custom design that you created for an older HTML report. Of the files that contain the data/design, some can be safely copied over from an older report while others cannot. The table in the sections below show which files can safely be copied into a version 6.7.4 report.
| File | Notes |
|---|---|
| Data files (data.js and supporting theme files) | Yes, can be copied to a v6.7.4 report |
| Stylesheet (default.css) | Yes, can be copied to a v6.7.4 report. Note that the old style sheet will not contain new settings which were introduced in newer versions.1 |
| Configuration file (config.xml) | Yes, can be copied to a v6.7.4 report. Note that the old configuration file will not contain new settings or components which were introduced in newer versions. If you wish to make use of these, please use the Configuration File Converter within the Resource Library to update your old config.xml file. |
1 If you are using map labels and your old stylesheet is of version 6.6.0 or 6.6.1 you will not be able to copy it into a 6.7.4 report as the labels may not appear as expected.