
Contents
Introduction
This article describes how to create dynamic buttons in HTML Edition Templates which will dynamically change to display different text after they have been clicked.
This is particularly useful if you are maximising the space in your dynamic report by having one (or more) components on top of each other, therefore requiring a button to switch between these different components and would prefer to have different text to display in the button to show the user what chart component will be displayed when the button is clicked. It is assumed that you have read the InstantAtlas Designer section of the InstantAtlas Desktop User Guide prior to reading this document.
The following example demonstrates how to create a dynamic button which will display ‘Time Series’ when the Bar Chart is displayed, and ‘Bar Chart’ when the Time Series Chart is displayed.
Config.xml configuration
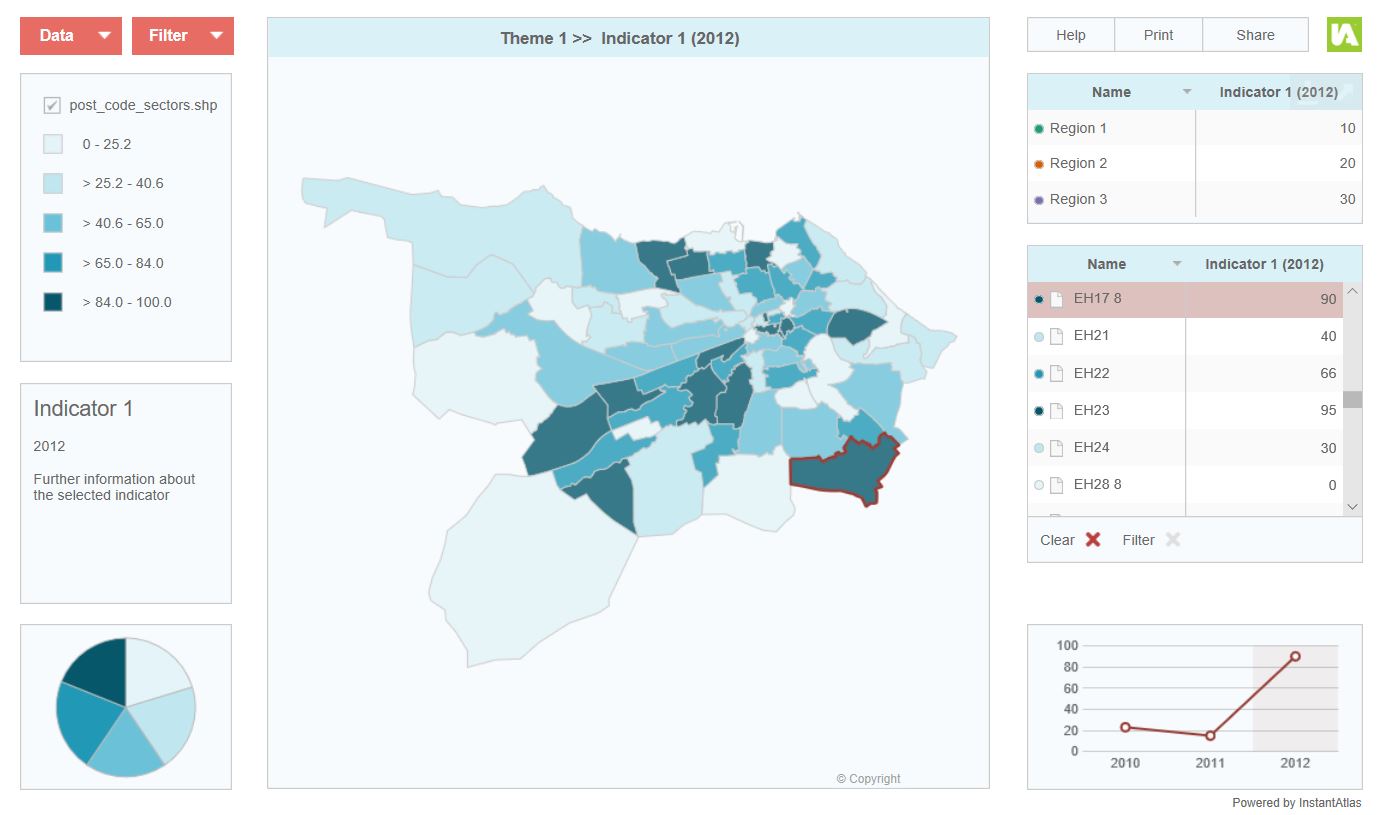
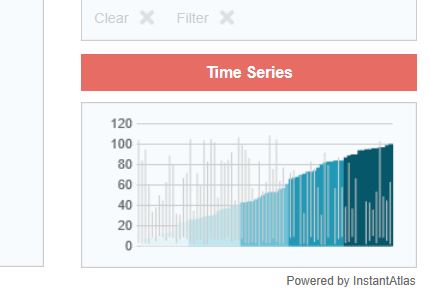
As you can see in below we have the Single Map HTML Template which has been configured to display the Time Series Chart and Bar Chart on top of each other.
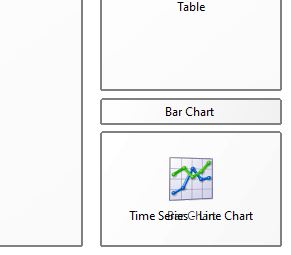
In the Designer, we shall now add in our first button called ‘Bar Chart’ and position it near the Bar Chart and Time Series Chart as seen below.
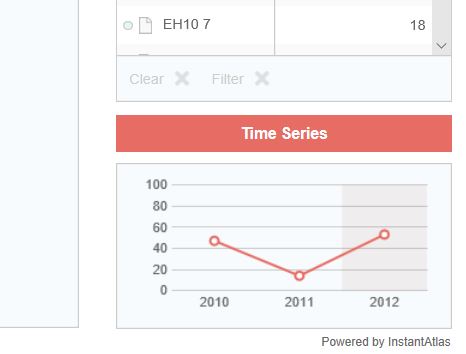
We shall now insert our second button called ‘Time Series’ and change its position so that they are exactly on top of each other. This will enable the ‘Time Series’ button to be displayed on start up.
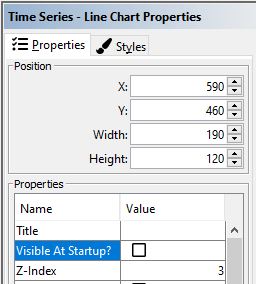
As the ‘Time Series’ button is visible on start up then we would not like the Time Series Chart to be visible on start up, but have the Bar Chart visible on start up instead. Therefore we need to make sure that in the properties of the Time Series Chart, ‘Visible At Startup?’ is unticked.
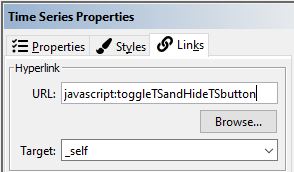
Now we need to insert the javascript function for the buttons, this will activate the custom javascript code. Select the Time Series button, and go to the Links tab, in the URL box type ‘javascript:toggleTSandHideTSbutton’.
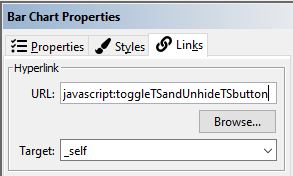
Select the Bar Chart button, and go to the Links tab, in the URL box type ‘javascript:toggleTSandUnhideTSbutton’.
Custom.js configuration
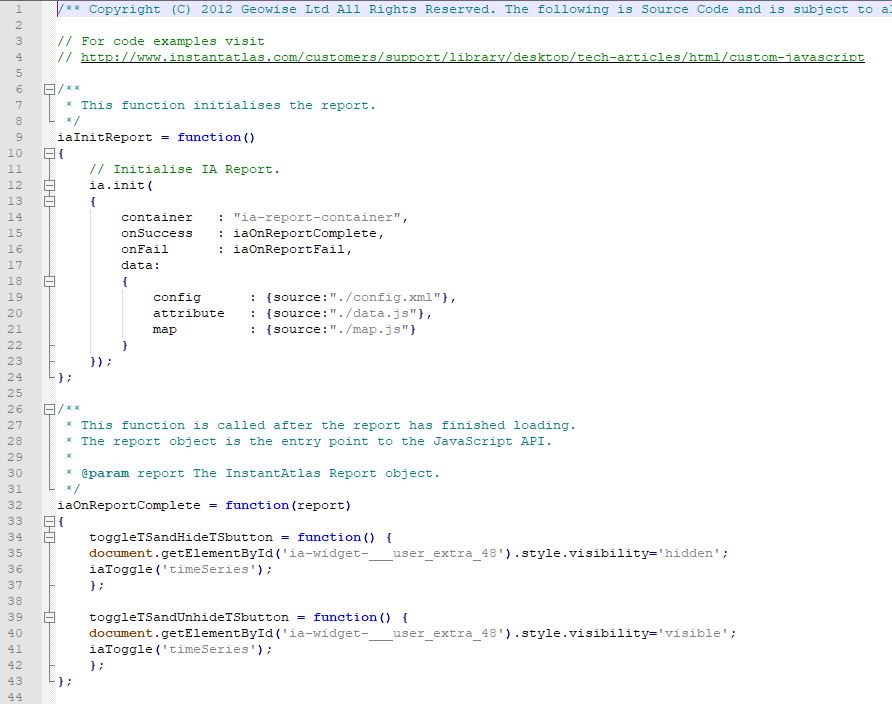
The custom.js file is the file that you will insert your customisable code to trigger the correct button to display and toggle the charts. This file will be located in your report folder. In its unedited state it will look similar to the image below.
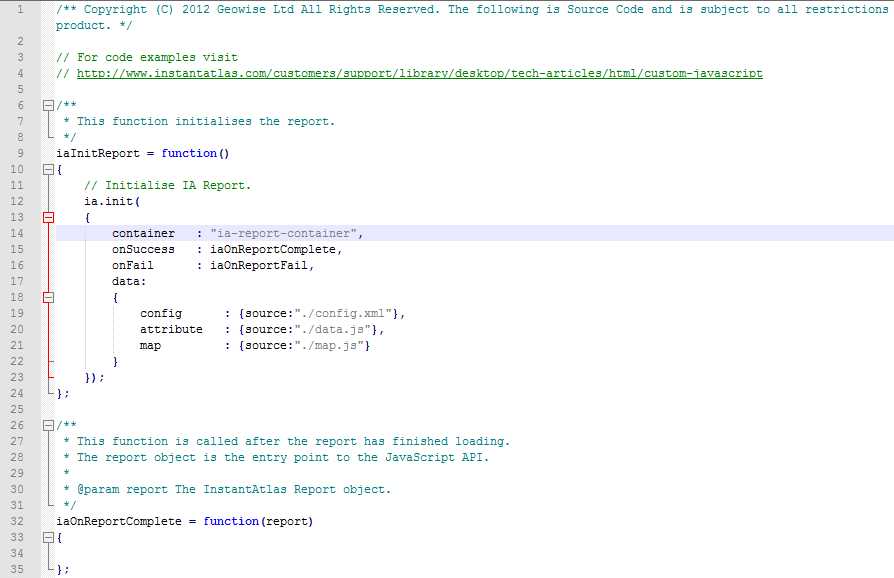
Copy and paste the following code between the curly brackets of the iaOnReportComplete = function(report) function (Line 34):
toggleTSandHideTSbutton = function() {
document.getElementById('ia-widget-___user_extra_48').style.visibility='hidden';
iaToggle('timeSeries');
};

toggleTSandUnhideTSbutton = function() {
document.getElementById('ia-widget-___user_extra_48').style.visibility='visible';
iaToggle('timeSeries');
};
The first part of this code, which is assigned to the Time Series button, states that when clicked it hides ‘___user_extra_48’ and toggles the Time Series Line Chart.
The second part of this code, which is assigned to the Bar Chart button, states that when clicked it shows ‘___user_extra_48’ and toggles the Time Series Line Chart.
‘___user_extra_48’ is the ID of the ‘Time Series’ button and ‘timeSeries’ is the ID of the Time Series Line Chart.
![]() Please note that the button ID may be different in your report. Right click on the button in the browser window and choose ‘inspect element’ to check on the ID.
Please note that the button ID may be different in your report. Right click on the button in the browser window and choose ‘inspect element’ to check on the ID.
The custom.js file with the new code should now look as follows.
Advanced
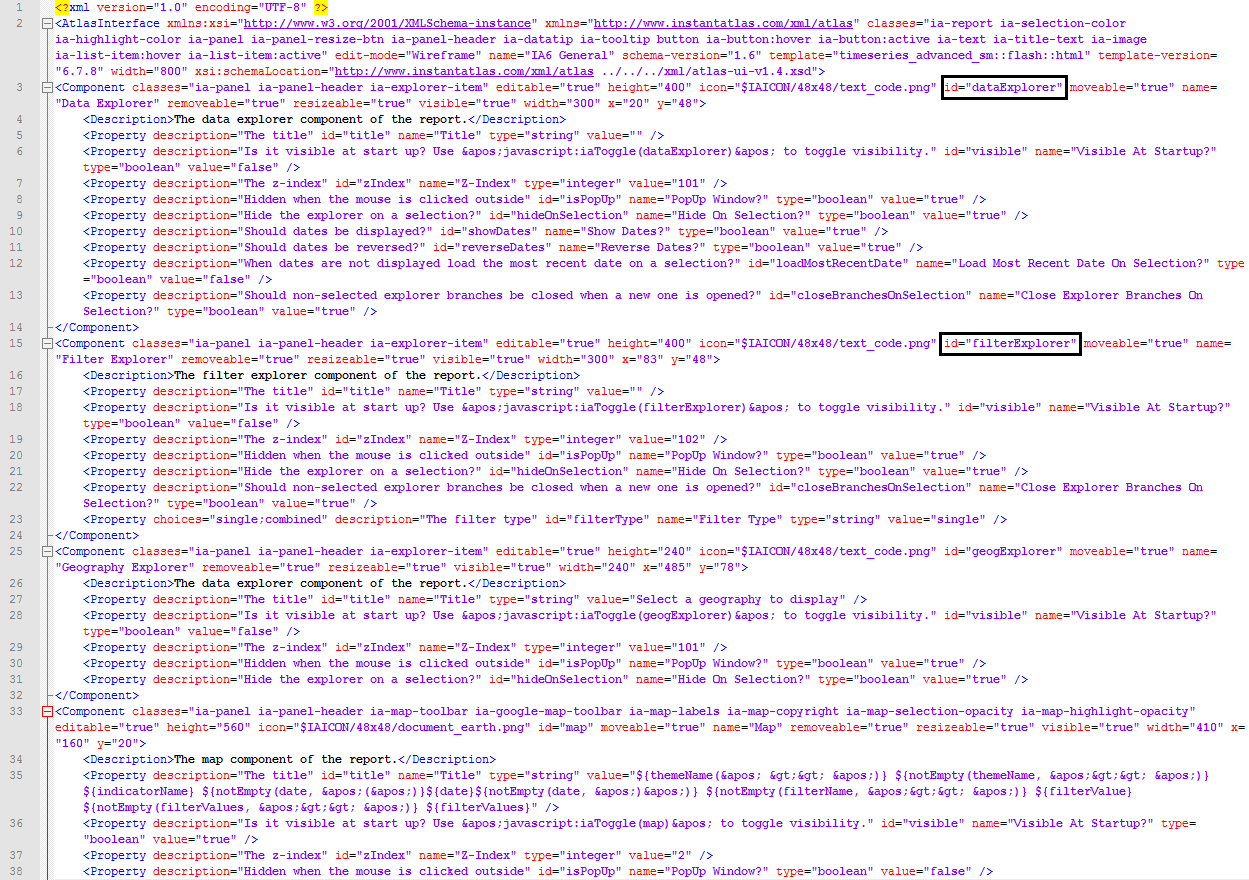
You can apply this method to other components by changing the code in the custom.js file to pick up the different components of the dynamic report. To do this you will need to know the ID’s of the different components. In the previous example these were ‘___user_extra_45’ which was the ID of the ‘Time Series’ button and ‘barChart’ which is the ID of the Bar Chart. The ID’s of the different components can be found in the config.xml file opened in a text editor, for example ‘id=”dataExplorer”’ as seen below.
The ID’s of your user added buttons will be found at the end of the config.xml file:
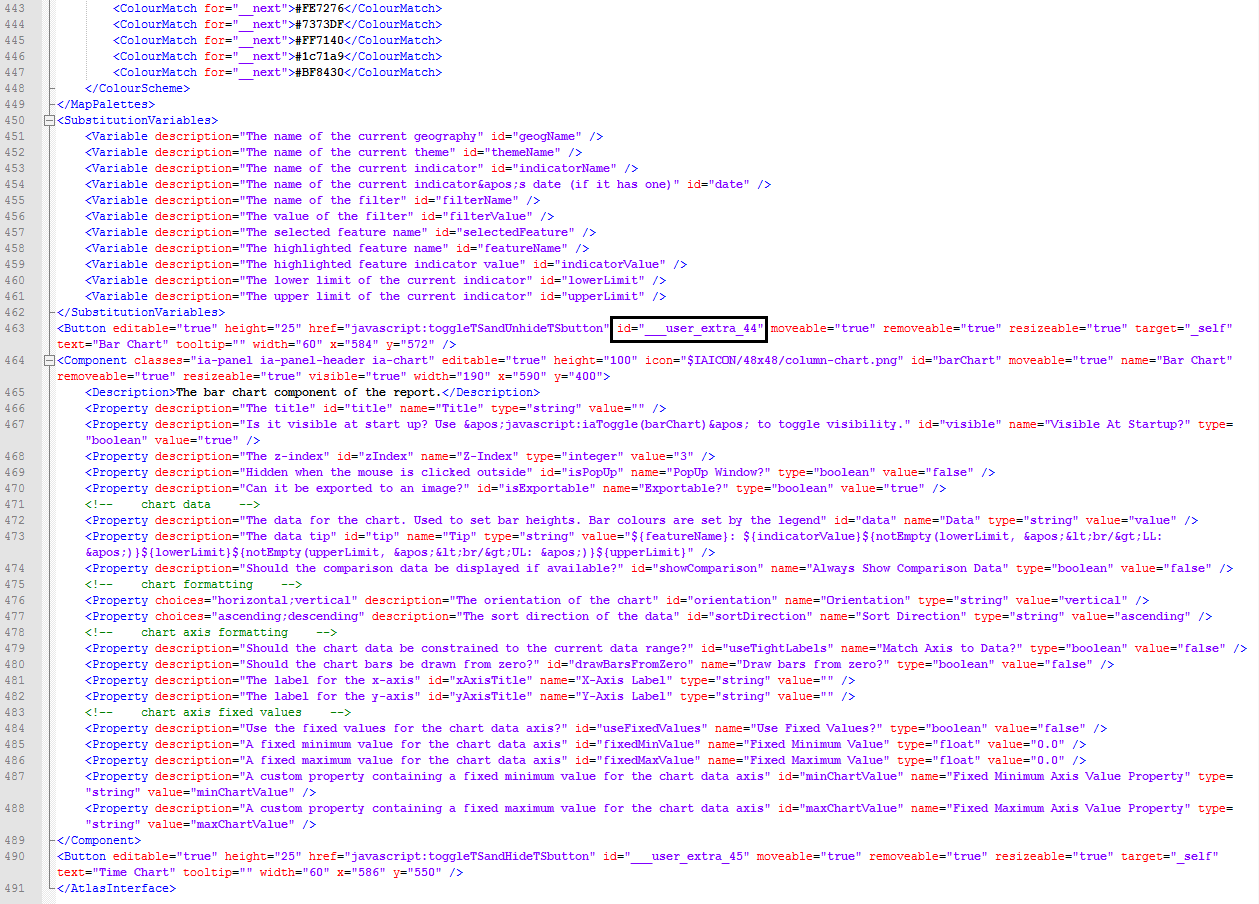
Replacing these ID’s in the code from section ‘custom.js configuration’ and modifying your functions will enable you to create dynamic buttons and toggle the visibility of other chart components.