
Contents
Introduction
This guide describes the use of the InstantAtlas Area Breakdown Pie Chart component. The side-by-side pie charts allow you to view data about a selected and comparator geographic feature. The source of the data shown can be the indicators themselves or associates of an indicator.
The Area Breakdown Pie Chart component is currently available in all of the released HTML Edition templates.
Inserting the Area Breakdown Pie Chart Component and its Legend
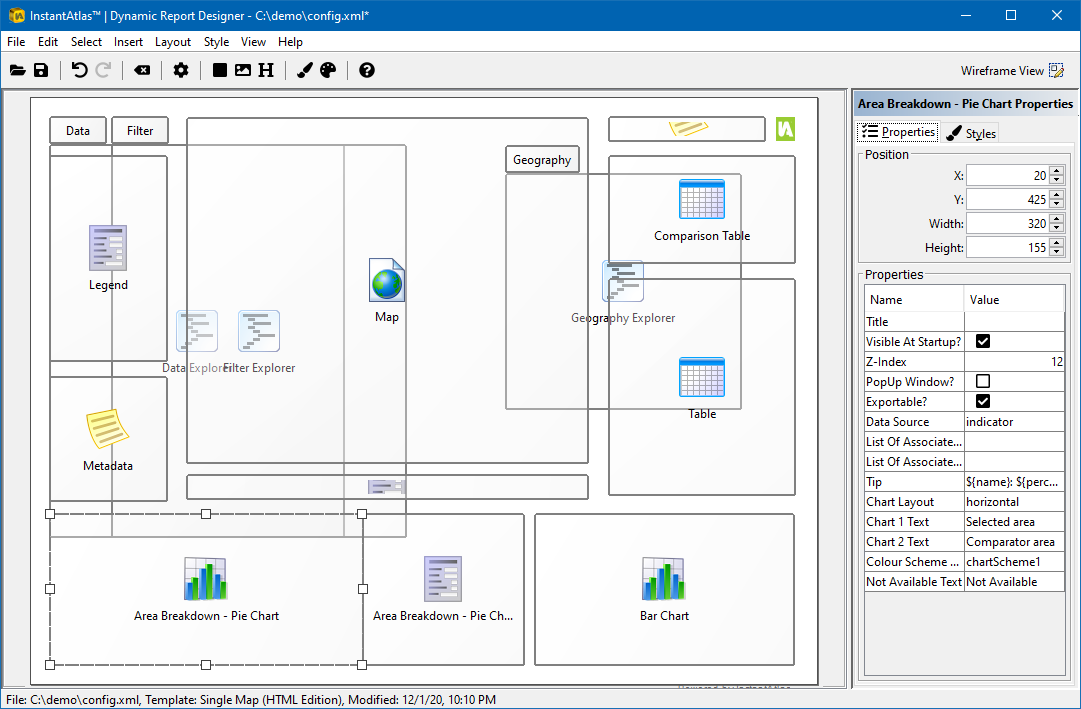
The Area Breakdown Pie Chart component is set to be invisible by default. Once you have published a dynamic report you should open the config.xml file of the report using the InstantAtlas Designer. Use the ‘Insert’ menu to insert the ‘Area Breakdown – Pie Chart’ component and the ‘Area Breakdown – Pie Chart Legend’ component.
Preparing the Data for Your Report
The Area Breakdown Pie Chart component has two pie charts. By default the first will display data for a feature selected in the map and the second for a comparator feature that is hovered. The slices in the pie chart will represent either indicator or associate values depending on your setting for the ‘Data Source’ property:
Indicator – the slices in the pies will represent the indicators in the active theme
Associate – the slices in the pies will represent the associates for the active indicator
The way you prepare the data for the report depends on which Data Source setting you intend to use.
Indicator Data Source
You should use a Data Source setting of ‘Indicator’ if you wish the values shown in your Advanced Pie Chart component to be also displayed in the other components (map, bar chart, table, etc).
If using this method you must simply ensure that the indicators you include in each theme add up to a logical total. For example, in a theme called ‘Population’ you could include the following indicators:
- Population in age group: 10 and under
- Population in age group: 11-20
- Population in age group: 21-30
- Population in age group: 31-40
- Population in age group: 41-50
- Population in age group: 51-60
- Population in age group: 61-70
- Population in age group: 70 or over
This would result in sensible pie charts as the indicators add up to a logical total: total population. Another example might be a theme called ‘Employment’ with the following indicators:
- % working in Agriculture; hunting; forestry
- % working in Construction
- % working in Education
- % working in Electricity, Gas and Water Supply
- % working in Financial intermediation
- % working in Fishing
- % working in Health and social work
- % working in Hotels and catering
- % working in Manufacturing
- % working in Mining and quarrying
- % working in Public administration and defence
- % working in Real estate; renting and business activities
- % working in Transport storage and communication
- % working in Wholesale & retail trade; repair of motor vehicles
- % working in Other employment
This would also result in sensible pie charts as the indicators add up to a logical total: total employed.
The example below will not result in sensible pie charts. Imagine a theme that contains the following indicators:
- Population in age group: 10 and under
- People working in Agriculture; hunting; forestry
- Directly standardised mortality rate from all cancers
- Average household income
This would not result in sensible pie charts because the indicators do not add up to any logical total.
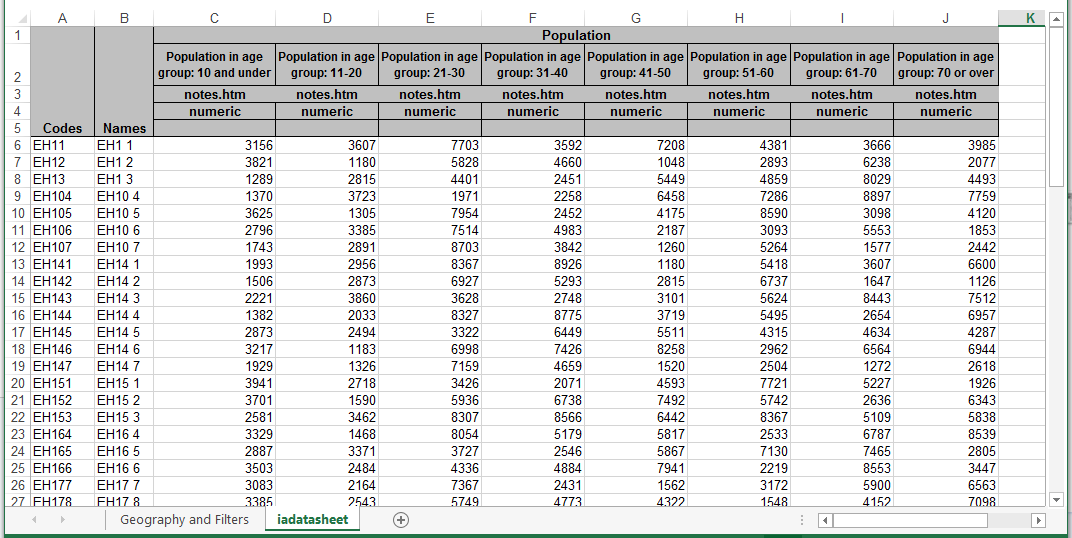
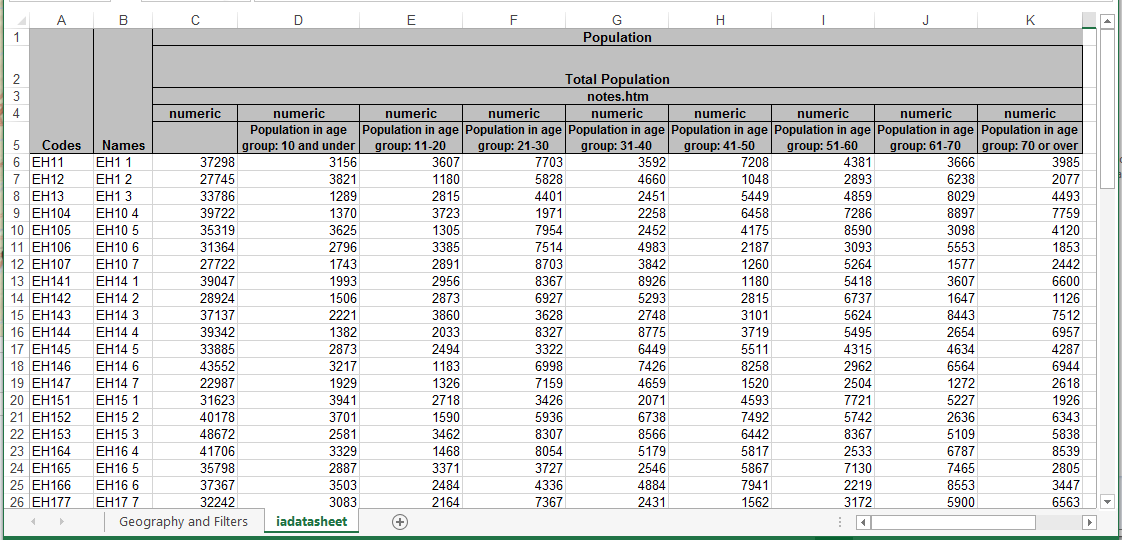
The image below shows how the ‘iadatasheet’ worksheet of your Excel Data Manager would look for the population example given above.
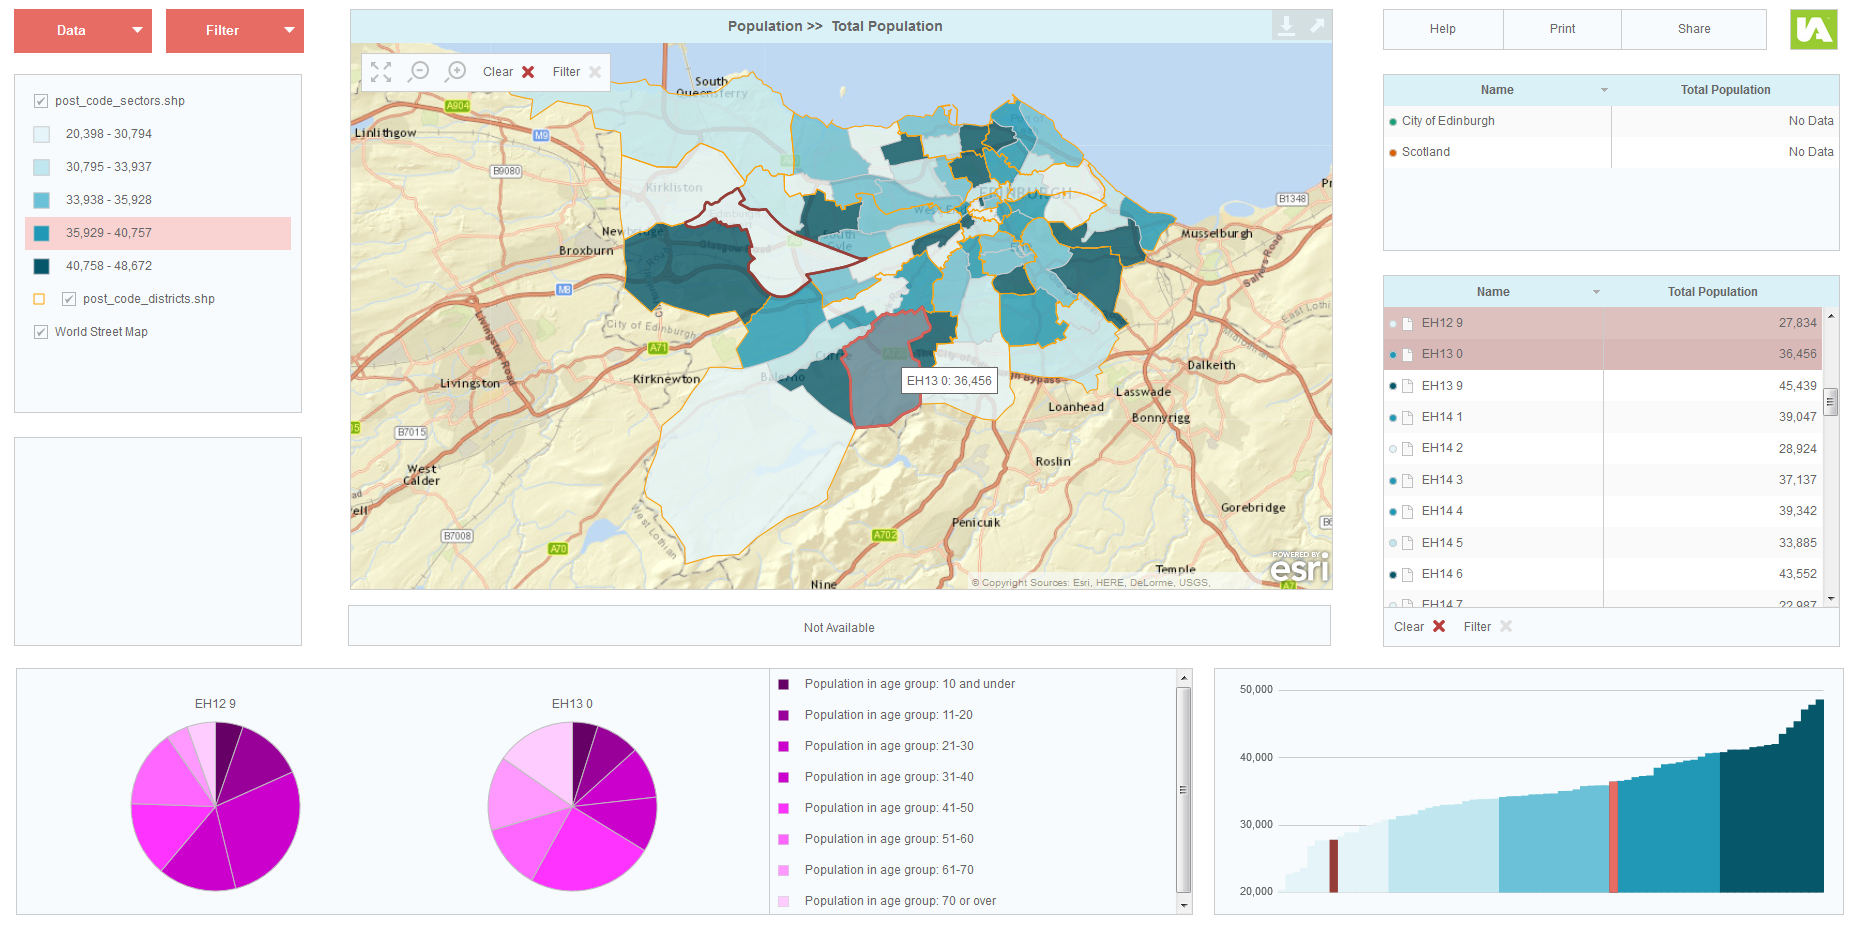
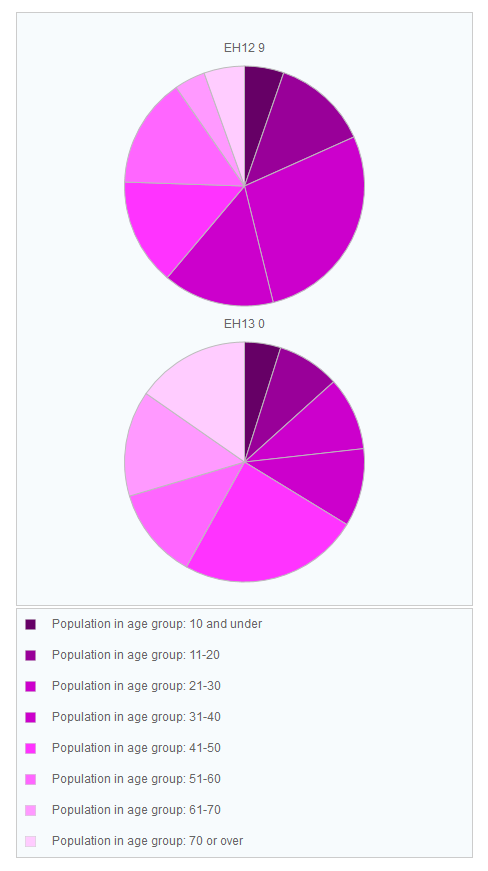
The resulting pie charts can be seen in the image below. The pie chart to the left is for the selected post code sector (EH 12 9) and the chart to the right is for the post code sector being hovered with the mouse pointer (EH 13 0). Their corresponding legend is displayed in the Area Breakdown Pie Chart Legend component.
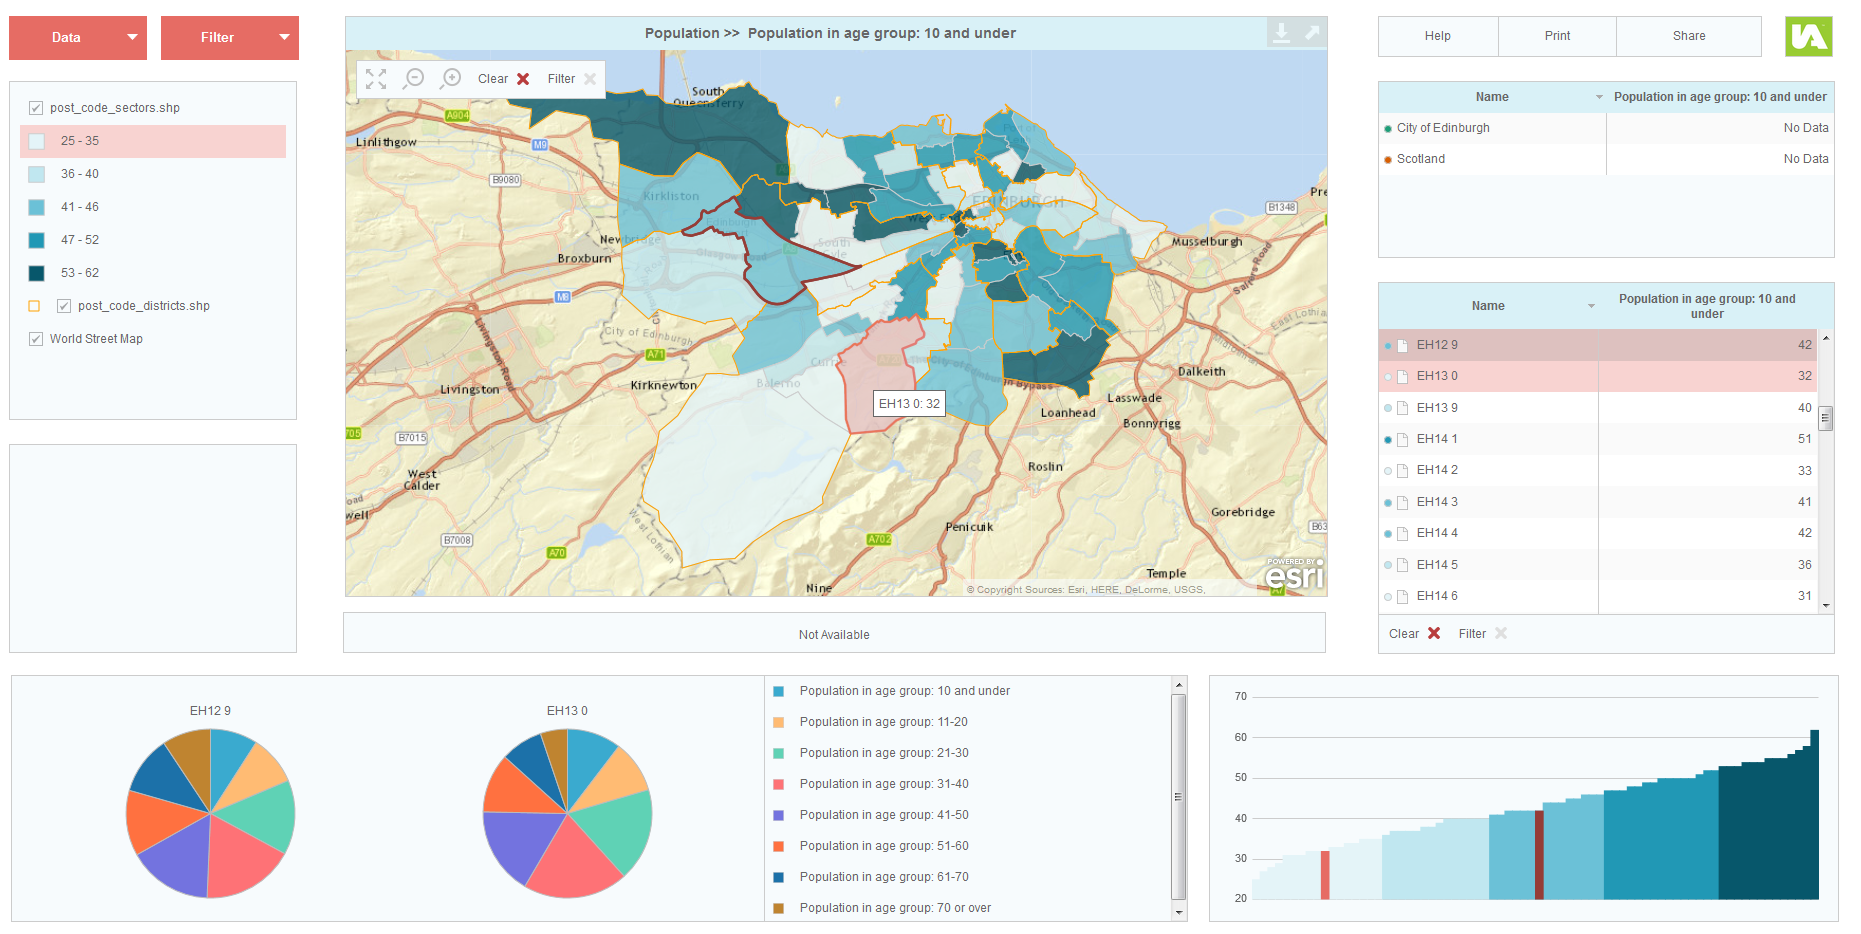
Each pie slice depicts the proportion of the population in each age group and is represented by a different colour. The colour scheme used in the pie charts is defined in the ‘Colour Scheme Name’ property, its colours can be customised in the ‘Map Palettes & Colour Schemes’ dialog box.
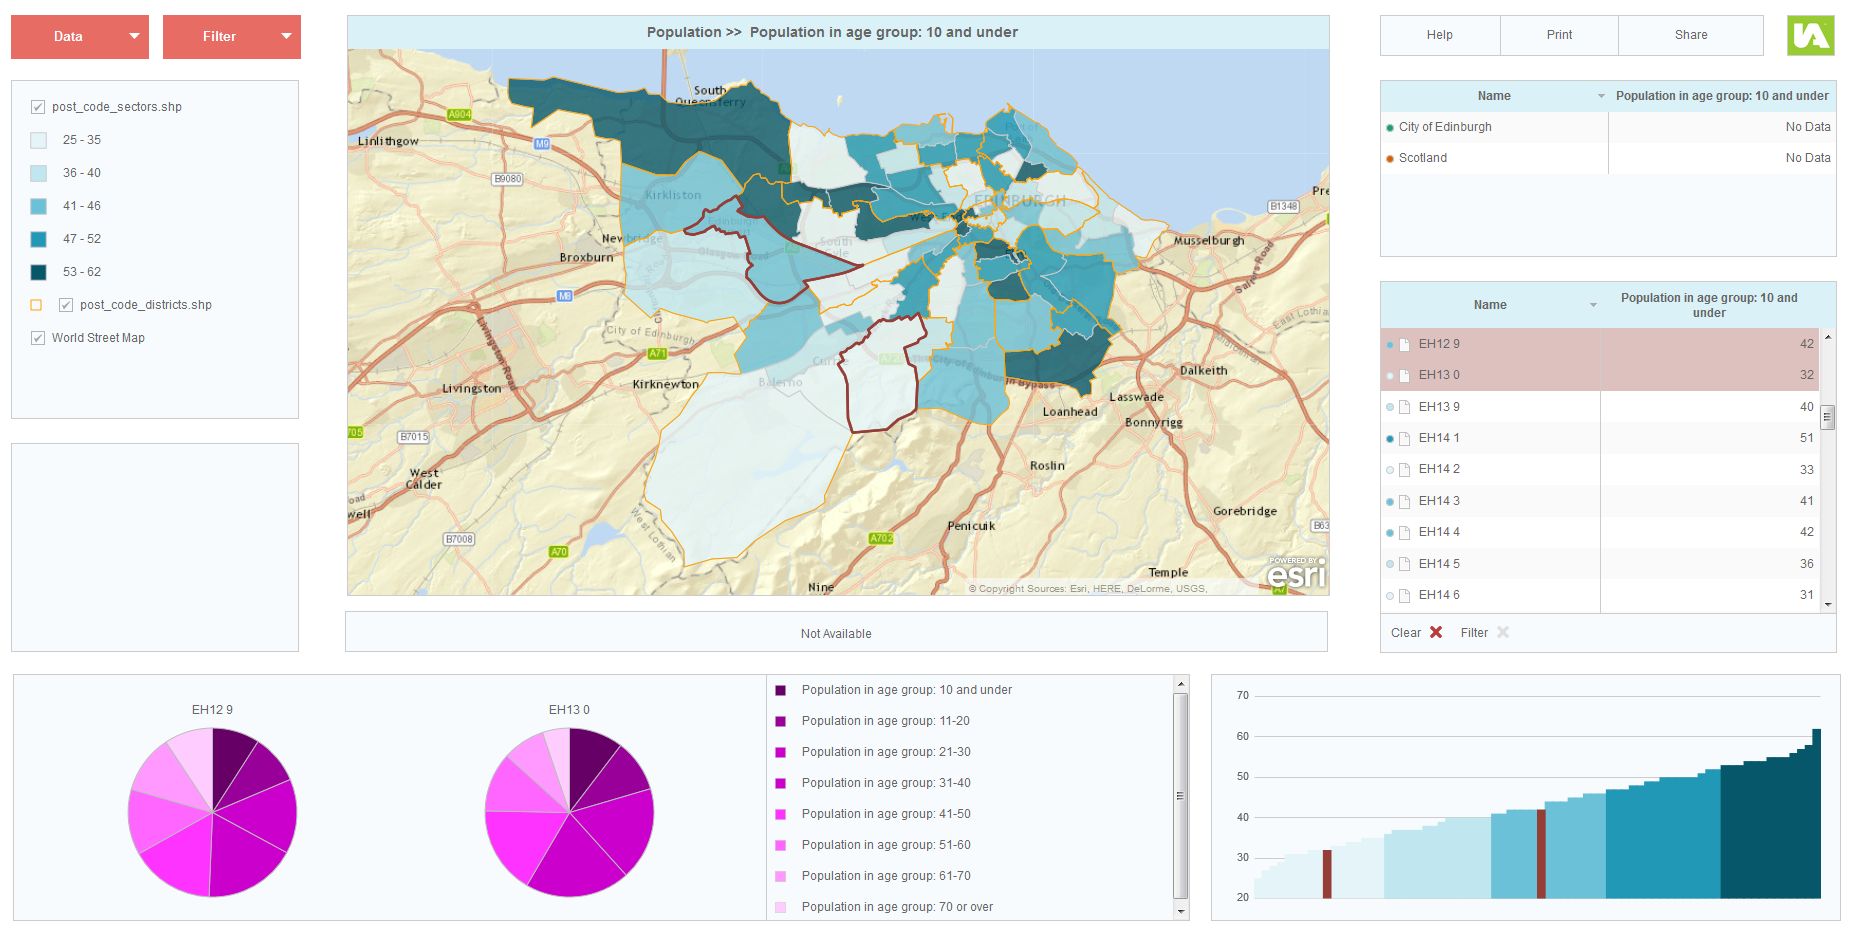
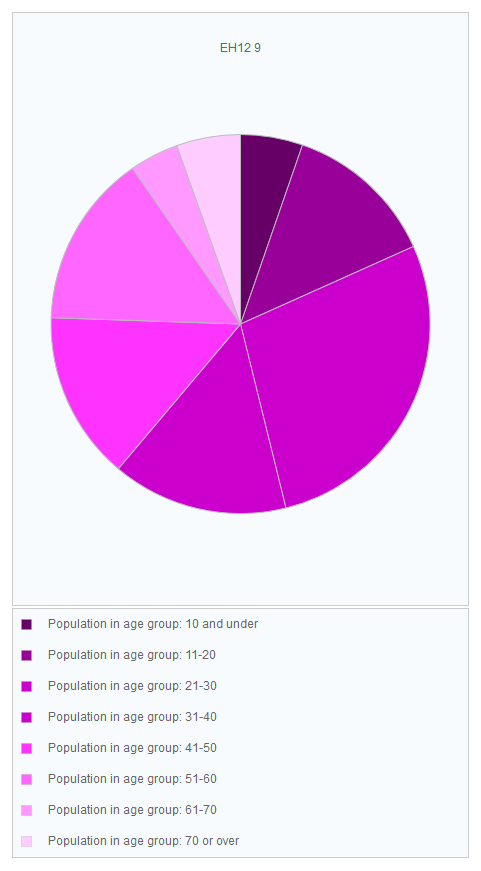
In the image below, an order to the age groups has been implied by editing the pie colours.
Associate Data Source
If you prefer the Area Breakdown Pie Chart to show values that will not be displayed in the other components of the report you should use a Data Source setting of ‘Associate’.
The same population example will be used in this section but this time imagine that you wish to show the age group variables in the Area Breakdown Pie Chart component only and not in any of the other components (map, bar chart, table, etc).
In the iadatasheet you should make the age group data associates of an indicator. In the image below, the indicator is ‘Total Population’ and the age group values have been added to the right of the indicator values as associates. Cell C3 has been merged across all of the columns so that the age groups are associates of the indicator.
You should then edit the properties of the Area Breakdown Pie Chart component in the Designer. You should set the ‘Data Source’ pick list to ‘Associate’.
The report will look similar to that shown in the image below. The indicator being displayed in the map, bar chart, table, etc is ‘Total Population’. The Area Breakdown Pie Chart component gives a more detailed breakdown by displaying the age group associates for that indicator.
If you are using this approach, you will have to ensure that all of the indicators in your report have associates that are sensible to show in the Area Breakdown Pie Chart component.
Additional Configuration Properties
List of Associates To Ignore
With the Data Source set to ‘Associate’, all associate columns of the selected indicator will by default be part of the Area Breakdown Pie Chart. However, as mentioned above, the categories for the Area Breakdown Pie Chart should always add up to a logical total. If you would like to include additional associates into your report, which do not belong to the logical total but which you might wish to display in the data table, you can add them to the ‘List of Associates To Ignore’. These associates will then not be included into the Area Breakdown Pie Chart.
List of Associates Labels
If you are using the ‘Associate’ data source, you can define a ‘List of Associate Labels’ to globally specify alias labels for the chart categories. Those can be different from the names of your associate columns.
Chart Layout
In addition to the horizontal chart layout as shown in previous pie chart examples, you can set the component to adopt a vertical layout or a single chart layout if you wish.
Tip
This property allows you to modify the tooltip which appears when a user hovers over one of the area breakdown pie chart slices with the mouse. For example if the values you are using in the chart are already percentages, you may want to delete the second percentage value that is calculated by the report.
Chart Text
Add some text that will be displayed above each pie chart.
Colour Scheme Name
The colours for the categories of the advanced pie chart are assigned from a pre-defined categoric colour scheme. You can view and edit colour schemes in the Designer by clicking on ‘Style’ – ‘Palettes’ in the menu bar. In the ‘Map Palettes and Colour Schemes’ dialog, select the ‘Colour Schemes (textual data)’ tab. The name of your chosen colour scheme needs to be entered into the Colour Scheme Name property.
Not Available Text
If your data does not contain multiple indicators in the selected theme or multiple associates for the selected indicator, the Area breakdown Pie Chart with display the text you enter into the Not Available Text property.