
Contents
Introduction
This document describes the options for streaming indicator data into an InstantAtlas report. It is assumed that you have already read the Excel Data Manager section of the InstantAtlas Desktop Guide. Also basic knowledge of databases and programming is required.
The InstantAtlas Data Schema
InstantAtlas reports read in the data values from one or more data files that conform to the InstantAtlas data schema. For Flash reports these data files must be in XML format (*.xml) and for HTML5 reports they must be in JSON (JavaScript Object Notation) format (*.js or *.json). In both cases, the information held in the data file includes:
- Geographical feature IDs and names
- Data Themes
- Indicators within themes
- Dates for indicators
- Data Values
- Associate data values e.g. difference from national average
- Comparison values
- Filters
The information can be held in a single file (often called data.xml or data.js) or split into a master data file and referenced theme files. The advantage
of multiple files is that atlases only need to load one theme file at a time which can be useful if you have a lot of data in your report.
XML files can be validated against the InstantAtlas data schema using a XML schema definition file available in each template zip file. It is called something like atlas-data-v1.3.xsd (new versions are occasionally introduced with new templates). Validating JSON against the InstantAtlas schema is not currently automatable but online tools like jsonlint.com can check the JSON format of a file and highlight syntax errors.
Learning More About the InstantAtlas Data Schema
The easiest way to learn more about the data schema is to look at some examples. Try publishing an atlas and look at the default data.xml or data.js and referenced theme files.
Try using the InstantAtlas Excel or Access Data Manager to publish a data file. Also look at the user guide for this data manager. You can choose whether to create one or more data files.
- Summary diagrammatic view of the schema here
- Current XML schema here
- Current schema html documentation here
![]() You should remember that not all information in the schema is mandatory. At the simplest level it needs only include geography IDs, geography names, one theme, one indicator and some data values. The two simple examples below show the same data in both XML and JSON formats:
You should remember that not all information in the schema is mandatory. At the simplest level it needs only include geography IDs, geography names, one theme, one indicator and some data values. The two simple examples below show the same data in both XML and JSON formats:
 XML (data.xml):
<?xml version="1.0" encoding="UTF-8"?>
<?xml-stylesheet type="text/xsl" href="data-xml-2-html.xslt"?>
<AtlasData xmlns="http://data.instantatlas.com/atlas" version="1.3" >
<Geography id="Postcode_Districts" name="Postcode Districts"     type="polygon">
   <FeatureList>
       <Feature id="_1" name="AL3" >
       </Feature>
       <Feature id="_2" name="AL5" >
       </Feature>
       <Feature id="_3" name="B45" >
       </Feature>
       <Feature id="_4" name="B60" >
       </Feature>
   </FeatureList>
   <ThemeList>
       <Theme id="t0" name="Theme 1">
           <Indicator id="i0" name="Pop" type="numeric" href="">
              <Value for="_1">1100</Value>
              <Value for="_2">2000</Value>
              <Value for="_3">3300</Value>
              <Value for="_4">4200</Value>
           </Indicator>
      </Theme>
   </ThemeList>
   </Geography>
</AtlasData>
JSON (data.js):
{
   "version": "1.3",
   "geographies":
      [
          {
          "id": "Postcode_Districts",
          "name": "Postcode Districts",
          "type": "polygon",
          "features":
             [
                { "id": "_1", "name": "AL3" },
                { "id": "_2", "name": "AL5" },
                { "id": "_3", "name": "B45" },
                { "id": "_4", "name": "B60" }
             ],
             "themes":
                [
                   {
                   "id": "t0",
                   "name": "Theme 1",
                   "indicators":
                      [
                         {
                         "id": "i0",
                         "name": "Pop",
                         "type": "numeric",
                         "href": "",
                         "values": [ 1100,2000,3300,4200 ]
                         }
                      ]
                   }
                ]
          }
      ]
}
As can be seen in the above examples, the data structure is the same in each file, only the format is different. The only significant, structural difference between the two file formats is in the list of values for an indicator. In JSON, these values MUST appear in the same order as the features in the feature list. In XML they can appear in any order because they have an attribute that explicitly associates each value with a feature.
Static Data Files
The majority of InstantAtlas users generate reports that work off static data files generated using the IA Excel or Access Data Managers. In most scenarios this works very well. The person creating the reports makes the decision on how indicators should be grouped together under themes and where there are large volumes of data they can split data into multiple data files to help improve performance. While most users of InstantAtlas find using the Data Manager a very easy and flexible method of generating the data files there are a number of disadvantages:
- All your data has to go through one of the data managers. If your
data is already in an existing database this may seem like an extra
overhead. - The groupings of indicators in the atlas are determined by the
report author rather than end users of the atlas. - If your data is changing frequently it may be easier to hold it in a
database and generate the data files on demand. - If you have very large volumes of data you may need to generate
multiple atlases to help divide up the data sensibly.
Linking to Alternative Static Files
By default an InstantAtlas report looks for its indicator data in a file called data.js. This file is located in the same folder as the other atlas files. It could be generated using the Excel / Access Data Managers or by some other program capable of writing to this format. One way to extend the data range supported by a dynamic report is to create links for a report to different static data files. This is achieved by adding a parameter called ‘data’ to the URL that requests the report. In this way, if you have a set of data files that are all appropriate to the same dynamic report you only need to publish the atlas once and then use different links to the atlas to populate it with different data.
The syntax takes the form:
http://mydomain.com/atlas.html?data=mydata
The example above would look for a data file called mydata.js in the same folder as the atlas. Note that the file ending in the path is missed out.
Another example would be:
data=.%2Ffolder1%2Fdata1
This would look for a file called data1.js in a folder called folder1. Note that characters such as / and space should be suitably escaped as shown.
![]() For security reasons the data file must be held on the same web server as the report.
For security reasons the data file must be held on the same web server as the report.
Streaming the Data
An alternative to generating static data files is to generate the data file on the fly and stream it to the report. For example, your web application may allow users to pick and view indicator data as a simple html page. You could extend this to allow them to view that data in an InstantAtlas report. To do this a script would have to be written that generates data in the InstantAtlas JSON format.
You can imagine that given a table of indicator data as shown below, it would be fairly simple to write a script that produces the data file shown in this section.
| ID | Name | Pop | Crime A | Crime B | Crime Category |
| 1 | AL3 | 1100 | 0 | 0 | A |
| 2 | AL5 | 2000 | 7 | 0 | B |
| 3 | B45 | 3300 | 4 | 0 | B |
| 4 | B72 | 4200 | 1 | 0 | C |
| 5 | B73 | 5002 | 2 | 0 | G |
| 6 | B80 | 3434 | 3 | 5 | F |
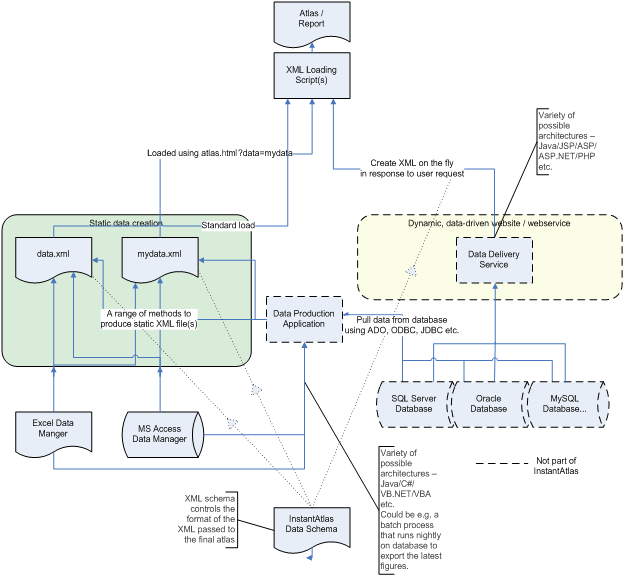
The diagram below illustrates the alternative data sources that could be used with InstantAtlas reports. Even though this diagram shows the data files in XML format, the same applies to data files in JSON format.
Linking to Streamed Data
To stream data directly from a database you need to produce a web page that is capable of pulling data from the database and returning it in the InstantAtlas json format. You can then point the atlas at this page. For example the following data parameter when added to the URL of the report would potentially pull unemployment data at ward level for 2006 from the database and display this in the InstantAtlas report.
data=/datdeliveryservice/getdata.jsp?indicator=unemployement&geog=war
ds&geogids=area1,area2,area3&date=jan2006&dummy=
![]() The final entry must be dummy=. This is required to overcome the issue that the report adds the files extension of .xml or .js automatically to the URL.
The final entry must be dummy=. This is required to overcome the issue that the report adds the files extension of .xml or .js automatically to the URL.
![]() To ensure a URL like this works you should escape characters. So the URL should be:
To ensure a URL like this works you should escape characters. So the URL should be:
http://mydomain.com/atlas.html?data=/datdeliveryservice/getdata.jsp%3Fin dicator%3Dunemployement%26geog%3Dwards%26geogids%3Darea1%2 Carea2%2Carea3%26date%3Djan2006%26dummy%3D
You can find a list of URL escape codes here: http://www.december.com/html/spec/esccodes.html
Worked Example Using a Simple Database Example
The following is presented as a simple illustration of the principles involved in generating data files on the fly. This uses a very simple database table to hold the data: In reality your database structure is likely to be more complicated than this. You may choose to implement a database view to enable the code example to work unchanged. More likely you will want to adjust the script to work with your own database structure. As a general rule, and especially as you start wanting to include filters and properties into your data file, the single table approach is likely to be less efficient.
Step 1
Create a database table. The example script pages use a SQL Server database called IAIntegration, with the database server sitting on the same machine as the web server. In the example a SQL Server account called AtlasUser with a password of AtlasUser is used to access this database. You may want to change this for your own example. The examples use a table called Example.
‘Appendix A – Database Scripts’ gives the SQL scripts to create and populate this table:
| GEOID | GEO_NAME | THEME | INDICATOR | INDICATORTYPE | DATE | VALUE |
| G1 | Area 1 | Theme 1 | Indicator 1 | numeric | 2000 | 1 |
| G2 | Area 2 | Theme 1 | Indicator 1 | numeric | 2000 | 2 |
| … | … | … | … | … | … | … |
This table is very simple, treating all fields as text fields. Some aspects of the data file that you would probably want to add to this information would be:
- Information on the geography being used. You might wish to hold the geography name and the type of geography (point, line, polygon) which are required in the final data file.
- Metadata links – Indicators and features may include href attributes that link to metadata pages. The location of these file may be dynamic depending on the data being viewed in which case you would need to include this information.
- Filters and Properties – as mentioned above these are probably best not included in a single table. However you will wish to consider which of these you wish to support for your atlases.
- Associate and Limit data – these data items which are supported by a number of the atlas templates would also need to be included in the table in order to get this data into the data file.
Step 2
Add a script to your website.
Appendix B – Web Page Scripts’ provides three example scripts, one in ASP.Net provided as a ASHX script, one in ASP and one in JSP that show how the Example table may be used to create an XML file. These examples employ a certain amount of hard coding but serve to demonstrate the principles. It is relatively straightforward to extend these scripts to be parameter driven in order to control the size of the XML generated. Similarly extending the functionality to include the additional items you might wish to include in the XML is not a huge task. Also these scripts can easily be adjusted to generate the data in JSON format for use with HTML reports.
Considerations When the Report Will Contain a Lot of Data
There are a number of issues that are worth considering if you wish your atlas to have access to a large number of indicators. In this case indicators refers to specific data that may be mapped, thus if you have a large number of dates in the system for a given indicator the same considerations apply.
The first option you might want to investigate is to ensure there are not too many indicators per theme. Having done this it is possible to refer to a separate theme file that contains the data for each theme in the system. Thus the main data file lists the features and the themes and indicators that are to be used in the atlas but instead of giving all the indicator data it includes a link to a separate file that contains the data for a particular theme.
Thus for example a theme entry in the main XML file becomes:
<ThemeFile theme-id="t0" theme-name="Economy" file-name="./Wards-t0.xml">

<Indicator id="i0" name="Incapacity Benefit (%)" type="rate"   date="1991" href="notes.htm"/>

<Indicator id="i0" name="Incapacity Benefit (%)" type="rate" date="2001" href="notes.htm"/>

<Indicator id="i1" name="JSA (%)" type="rate" date="1991" href="notes.htm"/>

<Indicator id="i1" name="JSA (%)" type="rate" date="2001" href="notes.htm"/>

</ThemeFile>
The advantage here is that the atlas only needs to load a theme worth of data at a time which will serve to improve performance. In the same way that the data file itself was dynamically generated the theme file can also be dynamically generated based on a set of parameters that are generated for the data file. Thus the example ASHX, ASP and JSP script files may be extended to include links to theme files which are themselves ASHX, ASP or JSP scripts.
The main XML file might then look like this:
<ThemeFile theme-id="t0" theme-name="Economy" file-name= "IAThemeXML.asp?ThemeName=Economy&InteractiveMapID=2&GeographyTypeID=5&AtlasID=2&geographyID=&MetaPath=true">

<Indicator id="i0" name="Incapacity Benefit(%)" type="rate" date="1991" href= "../../IndicatorLink.asp?AtlasID=2&GeographyTypeID=5&IndicatorDateGeographyID=13&InteractiveMapID=2">
</Indicator>

<Indicator id="i0" name="Incapacity Benefit (%)" type="rate"              date="2001" href= "../../IndicatorLink.asp?AtlasID=2&GeographyTypeID=5&IndicatorDateGeographyID=15&InteractiveMapID=2">
</Indicator>

<Indicator id="i1" name="JSA (%)" type="rate" date="1991" href="../../svgIndicatorLink.asp?AtlasID=2&GeographyTypeID=5&IndicatorDateGeographyID=9&InteractiveMapID=2">
</Indicator>

<Indicator id="i1" name="JSA (%)" type="rate" date="2001" href="../../IndicatorLink.asp?AtlasID=2&GeographyTypeID=5&IndicatorDateGeographyID=11&InteractiveMapID=2">
</Indicator>

</ThemeFile>
Appendix A – Database Scripts
SQL Script to Create the Table Example
CREATE TABLE [dbo].[Example](
  [GEO_ID] [varchar](50) COLLATE SQL_Latin1_General_CP1_CI_AS NULL,
  [GEO_NAME] [varchar](50) COLLATE SQL_Latin1_General_CP1_CI_AS NULL,
  [THEME] [varchar](50) COLLATE SQL_Latin1_General_CP1_CI_AS NULL,
  [INDICATOR] [varchar](50) COLLATE SQL_Latin1_General_CP1_CI_AS NULL,
  [INDICATORTYPE] [varchar](50) COLLATE SQL_Latin1_General_CP1_CI_AS NULL,
  [DATE] [varchar](50) COLLATE SQL_Latin1_General_CP1_CI_AS NULL,
  [VALUE] [varchar](50) COLLATE SQL_Latin1_General_CP1_CI_AS NULL )
ON [PRIMARY]
SQL Script to Populate the Table Example
insert into example (geo_id, geo_name, theme, indicator, indicatortype, date, value) values('G1', 'Area 1','Theme
1', 'Indicator 1', 'numeric', '2000', '1')
insert into example (geo_id, geo_name, theme, indicator, indicatortype, date, value) values('G2', 'Area 2','Theme
1', 'Indicator 1', 'numeric', '2000', '2')
insert into example (geo_id, geo_name, theme, indicator, indicatortype, date, value) values('G3', 'Area 3','Theme
1', 'Indicator 1', 'numeric', '2000', '3')
insert into example (geo_id, geo_name, theme, indicator, indicatortype, date, value) values('G4', 'Area 4','Theme
1', 'Indicator 1', 'numeric', '2000', '4')
insert into example (geo_id, geo_name, theme, indicator, indicatortype, date, value) values('G5', 'Area 5','Theme
1', 'Indicator 1', 'numeric', '2000', '5')
insert into example (geo_id, geo_name, theme, indicator, indicatortype, date, value) values('G6', 'Area 6','Theme
1', 'Indicator 1', 'numerica   ', '2000', '6')
insert into example (geo_id, geo_name, theme, indicator, indicatortype, date, value) values('G7', 'Area 7','Theme
1', 'Indicator 1', 'numeric', '2000', '7')
insert into example (geo_id, geo_name, theme, indicator, indicatortype, date, value) values('G1', 'Area 1','Theme
1', 'Indicator 1', 'numeric', '2001', '11')
insert into example (geo_id, geo_name, theme, indicator, indicatortype, date, value) values('G2', 'Area 2','Theme
1', 'Indicator 1', 'numeric', '2001', '12')
insert into example (geo_id, geo_name, theme, indicator, indicatortype, date, value) values('G3', 'Area 3','Theme
1', 'Indicator 1', 'numeric', '2001', '13')
insert into example (geo_id, geo_name, theme, indicator, indicatortype, date, value) values('G4', 'Area 4','Theme
1', 'Indicator 1', 'numeric', '2001', '14')
insert into example (geo_id, geo_name, theme, indicator, indicatortype, date, value) values('G5', 'Area 5','Theme
1', 'Indicator 1', 'numeric', '2001', '15')
insert into example (geo_id, geo_name, theme, indicator, indicatortype, date, value) values('G6', 'Area 6','Theme
1', 'Indicator 1', 'numeric', '2001', '16')
insert into example (geo_id, geo_name, theme, indicator, indicatortype, date, value) values('G7', 'Area 7','Theme
1', 'Indicator 1', 'numeric', '2001', '17')
insert into example (geo_id, geo_name, theme, indicator, indicatortype, date, value) values('G1', 'Area 1','Theme
1', 'Indicator 1', 'numeric', '2002', '21')
insert into example (geo_id, geo_name, theme, indicator, indicatortype, date, value) values('G2', 'Area 2','Theme
1', 'Indicator 1', 'numeric', '2002', '22')
insert into example (geo_id, geo_name, theme, indicator, indicatortype, date, value) values('G3', 'Area 3','Theme
1', 'Indicator 1', 'numeric', '2002', '23')
insert into example (geo_id, geo_name, theme, indicator, indicatortype, date, value) values('G4', 'Area 4','Theme
1', 'Indicator 1', 'numeric', '2002', '24')
insert into example (geo_id, geo_name, theme, indicator, indicatortype, date, value) values('G5', 'Area 5','Theme
1', 'Indicator 1', 'numeric', '2002', '25')
insert into example (geo_id, geo_name, theme, indicator, indicatortype, date, value) values('G6', 'Area 6','Theme
1', 'Indicator 1', 'numeric', '2002', '26')
insert into example (geo_id, geo_name, theme, indicator, indicatortype, date, value) values('G7', 'Area 7','Theme
1', 'Indicator 1', 'numeric', '2002', '27')
insert into example (geo_id, geo_name, theme, indicator, indicatortype, date, value) values('G1', 'Area 1','Theme
1', 'Indicator 2', 'numeric', '2000', '31')
insert into example (geo_id, geo_name, theme, indicator, indicatortype, date, value) values('G2', 'Area 2','Theme
1', 'Indicator 2', 'numeric', '2000', '32')
insert into example (geo_id, geo_name, theme, indicator, indicatortype, date, value) values('G3', 'Area 3','Theme
1', 'Indicator 2', 'numeric', '2000', '33')
insert into example (geo_id, geo_name, theme, indicator, indicatortype, date, value) values('G4', 'Area 4','Theme
1', 'Indicator 2', 'numeric', '2000', '34')
insert into example (geo_id, geo_name, theme, indicator, indicatortype, date, value) values('G5', 'Area 5','Theme
1', 'Indicator 2', 'numeric', '2000', '35')
insert into example (geo_id, geo_name, theme, indicator, indicatortype, date, value) values('G6', 'Area 6','Theme
1', 'Indicator 2', 'numeric', '2000', '36')
insert into example (geo_id, geo_name, theme, indicator, indicatortype, date, value) values('G7', 'Area 7','Theme
1', 'Indicator 2', 'numeric', '2000', '37')
insert into example (geo_id, geo_name, theme, indicator, indicatortype, date, value) values('G1', 'Area 1','Theme
1', 'Indicator 2', 'numeric', '2001', '41')
insert into example (geo_id, geo_name, theme, indicator, indicatortype, date, value) values('G2', 'Area 2','Theme
1', 'Indicator 2', 'numeric', '2001', '42')
insert into example (geo_id, geo_name, theme, indicator, indicatortype, date, value) values('G3', 'Area 3','Theme
1', 'Indicator 2', 'numeric', '2001', '43')
insert into example (geo_id, geo_name, theme, indicator, indicatortype, date, value) values('G4', 'Area 4','Theme
1', 'Indicator 2', 'numeric', '2001', '44')
insert into example (geo_id, geo_name, theme, indicator, indicatortype, date, value) values('G5', 'Area 5','Theme
1', 'Indicator 2', 'numeric', '2001', '45')
insert into example (geo_id, geo_name, theme, indicator, indicatortype, date, value) values('G6', 'Area 6','Theme
1', 'Indicator 2', 'numeric', '2001', '46')
insert into example (geo_id, geo_name, theme, indicator, indicatortype, date, value) values('G7', 'Area 7','Theme
1', 'Indicator 2', 'numeric', '2001', '47')
insert into example (geo_id, geo_name, theme, indicator, indicatortype, date, value) values('G1', 'Area 1','Theme
1', 'Indicator 2', 'numeric', '2002', '51')
insert into example (geo_id, geo_name, theme, indicator, indicatortype, date, value) values('G2', 'Area 2','Theme
1', 'Indicator 2', 'numeric', '2002', '52')
insert into example (geo_id, geo_name, theme, indicator, indicatortype, date, value) values('G3', 'Area 3','Theme
1', 'Indicator 2', 'numeric', '2002', '53')
insert into example (geo_id, geo_name, theme, indicator, indicatortype, date, value) values('G4', 'Area 4','Theme
1', 'Indicator 2', 'numeric', '2002', '54')
insert into example (geo_id, geo_name, theme, indicator, indicatortype, date, value) values('G5', 'Area 5','Theme
1', 'Indicator 2', 'numeric', '2002', '55')
insert into example (geo_id, geo_name, theme, indicator, indicatortype, date, value) values('G6', 'Area 6','Theme
1', 'Indicator 2', 'numeric', '2002', '56')
insert into example (geo_id, geo_name, theme, indicator, indicatortype, date, value) values('G7', 'Area 7','Theme
1', 'Indicator 2', 'numeric', '2002', '57')
insert into example (geo_id, geo_name, theme, indicator, indicatortype, date, value) values('G1', 'Area 1','Theme
2', 'Indicator 3', 'categoric', '2000', 'high')
insert into example (geo_id, geo_name, theme, indicator, indicatortype, date, value) values('G2', 'Area 2','Theme
2', 'Indicator 3', 'categoric', '2000', 'medium')
insert into example (geo_id, geo_name, theme, indicator, indicatortype, date, value) values('G3', 'Area 3','Theme
2', 'Indicator 3', 'categoric', '2000', 'low')
insert into example (geo_id, geo_name, theme, indicator, indicatortype, date, value) values('G4', 'Area 4','Theme
2', 'Indicator 3', 'categoric', '2000', 'high')
insert into example (geo_id, geo_name, theme, indicator, indicatortype, date, value) values('G5', 'Area 5','Theme
2', 'Indicator 3', 'categoric', '2000', 'medium')
insert into example (geo_id, geo_name, theme, indicator, indicatortype, date, value) values('G6', 'Area 6','Theme
2', 'Indicator 3', 'categoric', '2000', 'low')
insert into example (geo_id, geo_name, theme, indicator, indicatortype, date, value) values('G7', 'Area 7','Theme
2', 'Indicator 3', 'categoric', '2000', 'high')
insert into example (geo_id, geo_name, theme, indicator, indicatortype, date, value) values('G1', 'Area 1','Theme
2', 'Indicator 3', 'categoric', '2001', 'medium')
insert into example (geo_id, geo_name, theme, indicator, indicatortype, date, value) values('G2', 'Area 2','Theme
2', 'Indicator 3', 'categoric', '2001', 'low')
insert into example (geo_id, geo_name, theme, indicator, indicatortype, date, value) values('G3', 'Area 3','Theme
2', 'Indicator 3', 'categoric', '2001', 'high')
insert into example (geo_id, geo_name, theme, indicator, indicatortype, date, value) values('G4', 'Area 4','Theme
2', 'Indicator 3', 'categoric', '2001', 'medium')
insert into example (geo_id, geo_name, theme, indicator, indicatortype, date, value) values('G5', 'Area 5','Theme
2', 'Indicator 3', 'categoric', '2001', 'low')
insert into example (geo_id, geo_name, theme, indicator, indicatortype, date, value) values('G6', 'Area 6','Theme
2', 'Indicator 3', 'categoric', '2001', 'high')
insert into example (geo_id, geo_name, theme, indicator, indicatortype, date, value) values('G7', 'Area 7','Theme
2', 'Indicator 3', 'categoric', '2001', 'medium')
insert into example (geo_id, geo_name, theme, indicator, indicatortype, date, value) values('G1', 'Area 1','Theme
2', 'Indicator 3', 'categoric', '2002', 'low')
insert into example (geo_id, geo_name, theme, indicator, indicatortype, date, value) values('G2', 'Area 2','Theme
2', 'Indicator 3', 'categoric', '2002', 'high')
insert into example (geo_id, geo_name, theme, indicator, indicatortype, date, value) values('G3', 'Area 3','Theme
2', 'Indicator 3', 'categoric', '2002', 'medium')
insert into example (geo_id, geo_name, theme, indicator, indicatortype, date, value) values('G4', 'Area 4','Theme
2', 'Indicator 3', 'categoric', '2002', 'low')
insert into example (geo_id, geo_name, theme, indicator, indicatortype, date, value) values('G5', 'Area 5','Theme
2', 'Indicator 3', 'categoric', '2002', 'high')
insert into example (geo_id, geo_name, theme, indicator, indicatortype, date, value) values('G6', 'Area 6','Theme
2', 'Indicator 3', 'categoric', '2002', 'medium')
insert into example (geo_id, geo_name, theme, indicator, indicatortype, date, value) values('G7', 'Area 7','Theme
2', 'Indicator 3', 'categoric', '2002', 'low')
Appendix B – Web Page Scripts
Example ASHX Script
<%@ WebHandler Language="C#" Class="IAStreamToXMLInline" %> using System;
using System.Collections.Generic;
using System.Xml;
using System.Web;
using System.IO;
using System.Configuration;
using System.Data.SqlClient;

 /// <summary>
 /// This is an example piece of code showing how to take data from a database and produce a data stream that can feed an atlas
 /// The code will need to be altered to take account of your own data structures
 /// </summary>

public class IAStreamToXMLInline : IHttpHandler
 {
 public void ProcessRequest(HttpContext context)
 {
 StringWriter sw = new StringWriter();
 System.Xml.XmlTextWriter writer = new System.Xml.XmlTextWriter(sw);
 String strQuery;
 String geoFeatures;
 String data;
 string theme;
 string indicator;
 string date;
 String strCurrentTheme = String.Empty;
 String strCurrentIndicator = String.Empty;
 String strCurrentDate = String.Empty;
 int iThemeCount;
 int iIndicatorCount;
 bool blnFirstData = true;
 int id;
 SqlCommand cmd;
 SqlDataReader reader;
 //get details of database connection
 ConnectionStringSettings settings;
settings = ConfigurationManager.ConnectionStrings["IAStreamConn"];
//create a connection to the database
SqlConnection conn = new SqlConnection(settings.ConnectionString);
conn.Open();
//create the standard XML staring elements
writer.WriteStartElement("AtlasData", "http://data.instantatlas.com/atlas");
writer.WriteAttributeString("xmlns", "ias", null, "http://server.instantatlas.com/metadata");
WriteAttribute(writer, "version", "1.3");
writer.WriteStartElement("Geography");
WriteAttribute(writer, "id", "geo"); // id of geography
WriteAttribute(writer, "name", "area type"); //name of geography
WriteAttribute(writer, "type", "polygon"); //type of geography - polygon, point, line

// do the features first
strQuery = "SELECT DISTINCT GEO_ID, GEO_NAME FROM Example ORDER BY GEO_ID";
cmd = new SqlCommand(strQuery, conn);
using (reader = cmd.ExecuteReader())
{
if (reader != null && reader.HasRows)
{
writer.WriteStartElement("FeatureList");
while (reader.Read())
{
writer.WriteStartElement("Feature");
WriteAttribute(writer, "id", reader.GetString(0)); // id of feature
WriteAttribute(writer, "name", reader.GetString(1)); //name of feature
WriteAttribute(writer, "href", "href=\".notes.htm\""); //link to feature metadata/notes
writer.WriteEndElement(); //Feature
}
reader.Close();
writer.WriteEndElement(); //FeatureList
}
}
//now get the data
iThemeCount = 0;
iIndicatorCount = 0;
strQuery = "SELECT THEME, INDICATOR, DATE, GEO_ID, INDICATORTYPE, VALUE FROM Example ORDER BY THEME,
INDICATOR, DATE, GEO_ID";
cmd = new SqlCommand(strQuery, conn);

using (reader = cmd.ExecuteReader())
{
if (reader != null && reader.HasRows)
{
writer.WriteStartElement("ThemeList");
while (reader.Read())
{
theme = reader.GetString(0);
indicator = reader.GetString(1);
date = reader.GetString(2);
if(!(theme == null || theme.Equals(strCurrentTheme)))
{
if (!String.IsNullOrEmpty(strCurrentTheme))
{
//close current indicator and theme elements
writer.WriteEndElement(); //Indicator
writer.WriteEndElement(); //Theme
}
strCurrentTheme = theme;
writer.WriteStartElement("Theme");
WriteAttribute(writer, "id", "t" + iThemeCount.ToString()); // id of theme
WriteAttribute(writer, "name", theme); //name of theme
iThemeCount++;
//must also be start of new indicator
if (!(indicator == null || indicator.Equals(strCurrentIndicator)))
iIndicatorCount++;
strCurrentIndicator = indicator;
strCurrentDate = date;

writer.WriteStartElement("Indicator");
WriteAttribute(writer, "id", "i" + iIndicatorCount.ToString()); // id of indicator
WriteAttribute(writer, "name", indicator); //name of indicator
if(!String.IsNullOrEmpty(date))
WriteAttribute(writer, "date", date); //date of the indicator instance
WriteAttribute(writer, "type", reader.GetString(4)); //type of the indicator
}
else if (!(indicator == null || indicator.Equals(strCurrentIndicator)) || !(date == null ||
date.Equals(strCurrentDate) ))
{
if (!String.IsNullOrEmpty(strCurrentIndicator))
{
//close current indicator element
writer.WriteEndElement(); //Indicator
}
if (!(indicator == null || indicator.Equals(strCurrentIndicator)))
iIndicatorCount++; //only increment for indicator change
strCurrentIndicator = indicator;
strCurrentDate = date;
writer.WriteStartElement("Indicator");
WriteAttribute(writer, "id", "i" + iIndicatorCount.ToString()); // id of indicator
WriteAttribute(writer, "name", indicator); //name of indicator
if (!String.IsNullOrEmpty(date))
WriteAttribute(writer, "date", date); //date of the indicator instance
WriteAttribute(writer, "type", reader.GetString(4)); //type of the indicator
}
writer.WriteStartElement("Value");
WriteAttribute(writer, "for", reader.GetString(3)); // id of feature
writer.WriteString(reader.GetString(5)); //value of indicator instance for feature
writer.WriteEndElement(); //Value
}
reader.Close();
if (!String.IsNullOrEmpty(strCurrentTheme))
{
//close current indicator and theme elements
writer.WriteEndElement(); //Indicator
writer.WriteEndElement(); //Theme
}
writer.WriteEndElement(); //ThemeList
}
}
//ensure database connection closed
conn.Close();
conn.Dispose();
//closing xml elements
writer.WriteEndElement(); //Geography
writer.WriteEndElement(); //AtlasData
//write result to response stream
writer.Flush();
context.Response.ContentType = "text/xml";
context.Response.Write(sw.ToString());
}
private void WriteAttribute(System.Xml.XmlTextWriter writer, string name, object value)
{
writer.WriteStartAttribute(name);
writer.WriteValue(value);
writer.WriteEndAttribute();
}
public bool IsReusable
{
get
{
return false;
}
}
}
Example ASP Script
<%Response.ContentType="text/xml"%>
<%
Class FastString
private aFStrings()
private iFSPos
private iFSLen
private iFSIncr
Private Sub Class_Initialize()
iFSPos = 0
iFSIncr = 1000
ReAllocString(iFSIncr)
End Sub
Private Sub Class_Terminate()
End Sub
Private Sub ReAllocString(byval length)
if length>iFSLen then
iFSLen = length+iFSIncr
else
exit sub
end if
redim preserve aFStrings(iFSLen)
End Sub
Public Property Let sContents(byval sData)
ReAllocString(iFSPos)
aFStrings(iFSPos) = sData
iFSPos = iFSPos + 1
End Property
Public Default Property Get sContents()
on error resume next
if iFSPos = 0 then
sContents = ""
else
sContents = join(aFStrings, "")
end if
End Property
Public Function Reset()
iFSLen = iFSIncr
redim aFStrings(iFSLen)
End Function
End Class
Function CleanGeographyID(sGeoID)
Dim iChar
If InStr(1, sGeoID, " ") Then
Response.write "Geography IDs cannot contain spaces. Please inform your system administrator."
Response.End
End If
If Len(sGeoID) = 0 Then
sGeoID = "_"
End If
CleanGeographyID = CleanXML(sGeoID)
End Function
Public Function CleanXML(ByVal sText)
If Not IsEmpty(sText) Then
sText = Replace(sText, "&", "&")
sText = Replace(sText, """", """)
sText = Replace(sText, ">", ">")
sText = Replace(sText, "<", "<")
sText = Replace(sText, "&amp;", "&")
sText = Replace(sText, "&#", "&#")
sText = Replace(sText, "&quot;", """)
sText = Replace(sText, "&gt;", ">")
sText = Replace(sText, "&lt;", "<")
End If
if FULLTEXTCLEAN = true then
sText = CleanAscii(sText)
end if
CleanXML = sText
End Function
Function CleanAscii(ByVal sText)
Dim sChar
Dim iLoop
Dim icode
Dim sRet
sRet = ""
If Len(sText) > 0 Then
For iLoop = 1 To Len(sText)
sChar = Mid(sText, iLoop, 1)
icode = AscW(sChar)
If icode > 127 Then
sRet = sRet & "&#" & icode & ";"
ElseIf icode < 0 Then
sRet = sRet & "&#" & 65536 + icode & ";"
Else
sRet = sRet & sChar
End If
Next
End If
CleanAscii = sRet
End Function
Dim strConn
Dim objConn
Dim strQuery
dim objRS
dim geoFeatures
dim data
dim strCurrentTheme
dim strCurrentIndicator
dim strCurrentDate
dim iThemeCount
dim iIndicatorCount
dim blnFirstData
dim id
strConn = "File Name=c:\data\IAInt\Connections\IAInt.udl"
Set objConn = Server.CreateObject("ADODB.Connection")
objConn.open strConn
'This example is based on a simple single table with the following structure
' GEO_ID varchar(50)
' GEO_NAME varchar(50)
' THEME varchar(50)
' INDICATOR varchar(50)
' INDICATORTYPE varchar(50)
' DATE varchar(50)
' VALUE varchar(50)
'The example simply pulls all the data out of the table
'It is trivial to extend the page to pull out data for subsets
'for example to restrict to particular areas, themes, indicators or dates
strQuery = "SELECT GEO_ID, GEO_NAME, THEME, INDICATOR, INDICATORTYPE, DATE, VALUE " & _
"FROM EXAMPLE " & _
"ORDER BY THEME, INDICATOR, DATE, GEO_ID"
Set objRS = objConn.Execute(strQuery)
if objrs.eof then
'generate an error
else
'write out the xml
set geoFeatures=new FastString
set data=new FastString
iThemeCount= 0
iIndicatorCount = 0
strCurrentTheme = objrs("THEME")
data() = "<Theme id=""t" & iThemeCount & """ name="""
data() = strCurrentTheme
data() = """ >"
strCurrentIndicator = objrs("INDICATOR")
strCurrentDate = objrs("Date")
data() = "<Indicator id=""i" & iIndicatorCount & """ name="""
data() = strCurrentIndicator
data() = """ date="""
data() = strCurrentDate
data() = """ type="""
data() = CleanXML(objrs("INDICATORTYPE"))
data() = """ >"
blnFirstData = true
do while not objrs.eof
if strCurrentTheme <> objrs("THEME") then
strCurrentTheme = objrs("THEME")
strCurrentIndicator = objrs("INDICATOR")
strCurrentDate = objrs("Date")
blnFirstData = false
iThemeCount = iThemeCount + 1
iIndicatorCount = iIndicatorCount + 1
data() = "</Indicator>"
data() = "</Theme>"
data() = "<Theme id=""t" & iThemeCount & """ name="""
data() = strCurrentTheme
data() = """ >"
data() = "<Indicator id=""i" & iIndicatorCount & """ name="""
data() = strCurrentIndicator
data() = """ date="""
data() = strCurrentDate
data() = """ type="""
data() = CleanXML(objrs("INDICATORTYPE"))
data() = """ >"
elseif strCurrentIndicator <> objrs("INDICATOR") then
strCurrentIndicator = objrs("INDICATOR")
strCurrentDate = objrs("Date")
blnFirstData = false
iIndicatorCount = iIndicatorCount + 1
data() = "</Indicator>"
data() = "<Indicator id=""i" & iIndicatorCount & """ name="""
data() = strCurrentIndicator
data() = """ date="""
data() = strCurrentDate
data() = """ type="""
data() = CleanXML(objrs("INDICATORTYPE"))
data() = """ >"
elseif strCurrentDate <> objrs("Date") then
strCurrentDate = objrs("Date")
blnFirstData = false
data() = "</Indicator>"
data() = "<Indicator id=""i" & iIndicatorCount & """ name="""
data() = strCurrentIndicator
data() = """ date="""
data() = strCurrentDate
data() = """ type="""
data() = CleanXML(objrs("INDICATORTYPE"))
data() = """ >"
end if
id = CleanGeographyID(objrs("GEO_ID"))
if blnFirstData = true then
'set the features list
geoFeatures() = "<Feature id="""
geoFeatures() = id
geoFeatures() = """ name="""
geoFeatures() = CleanXML(objrs("GEO_NAME"))
geoFeatures() = """ href=""./notes.htm""/>"
end if
data() = "<Value for="""
data() = id
data() = """>"
data() = CleanXML(objrs("VALUE"))
data() = "</Value>"
objrs.movenext
Loop
data() = "</Indicator>"
data() = "</Theme>"
%>
<?xml version="1.0" encoding="UTF-8"?>
<AtlasData xmlns="http://data.instantatlas.com/atlas" version="1.2">
<Geography id="geo" name="area type" type="polygon">
<FeatureList>
<%= geoFeatures() %>
</FeatureList>
<ThemeList>
<%= data() %>
</ThemeList>
</Geography>
</AtlasData>
<%
set geoFeatures=nothing
set data=nothing
end if
objrs.close
set objrs = nothing
objConn.Close
Set objConn = Nothing
%>
Example JSP Script
<?xml version="1.0" encoding="UTF-8" ?>
<%@page contentType="text/xml"%>
<%@page pageEncoding="UTF-8"%>
<%@page import="java.sql.*" %>
<AtlasData xmlns="http://data.instantatlas.com/atlas" version="1.2">
<%

   // As this page is only an example, there is lots of hard-wiring in it!
   // ALL of this should be in a config file somewhere else! (e.g. under    /WEB-INF/)
   // To change table name, database URL etc. just change the settings below
   // The map layer ID can be found by using the IASS admin tools
   // The next two lines presume you are using MySQL - comment out for SQL Server
   //String dbUrl = "jdbc:mysql://localhost/InstantAtlasServerData";
   //Class.forName("com.mysql.jdbc.Driver");
   // Uncomment the next two lines for SQL Server

   String dbUrl =   "jdbc:sqlserver://localhost:1433;databaseName=IAIntegration";
Class.forName("com.microsoft.sqlserver.jdbc.SQLServerDriver");
   String dbUser = "AtlasUser";
   String dbPwd = "AtlasUser";
   String tableName = "Example";
   Connection c = null;

  // We need to buffer IDs and data because we don't want to loop more   than once

   StringBuffer geoFeatures = new StringBuffer();
   StringBuffer data = new StringBuffer();
       try {
           c = DriverManager.getConnection(dbUrl, dbUser, dbPwd);
           System.out.println("Got connection");
           String sql = "SELECT GEO_ID, GEO_NAME, THEME, INDICATOR,   INDICATORTYPE, DATE, VALUE FROM " +
           tableName + " WHERE THEME = 'Theme 2' AND INDICATOR = 'Indicator 3' AND DATE = '2000' ORDER BY THEME, INDICATOR, DATE, GEO_ID ";
           System.out.println(sql);
           PreparedStatement ps = c.prepareStatement(sql);
          //Statement ps = c.createStatement(sql);

          // Do the query
          ResultSet rs = ps.executeQuery();
          System.out.println("Executed query");
          int got = 0;
          String id;
          while (rs.next()) {
             System.out.println("Looping");
             // <Feature id="ID" name="NAME" href="./notes.htm"/>
            geoFeatures.append("\t\t\t<Feature id=\"");
            id = rs.getString(1);
            geoFeatures.append(id);
            geoFeatures.append("\" name=\"");
            geoFeatures.append(rs.getString(2));
            geoFeatures.append("\" href=\"./notes.htm\" />\n");
            data.append("\t\t\t\t\t<Value for=\"");
            data.append(id);
            data.append("\">");
            data.append(rs.getString(7));
            data.append("</Value>\n");
            got++;
            if (got > 1500)
                throw new Exception("Too many records in response to query '" + sql + "'");
         }
         rs.close();
         ps.close();
         c.close();
      }
      // Clean-up
      finally {
         if ((c != null) && !c.isClosed()) {
            try {
               c.close();
            }
            catch (SQLException ex) {
               pageContext.getServletContext().log("Non-fatal error? closing JDBC connection");
            }
         }
      }
%>
<Geography id="geo" name="area type" type="polygon">
   <FeatureList>
      <%= geoFeatures.toString() %>
   </FeatureList>
   <ThemeList>
      <Theme id="t0" name="Theme 1">
         <Indicator id="i0" name="Indicator 3" type="categoric">
            <%= data.toString() %>
         </Indicator>
      </Theme>
   </ThemeList>
</Geography>
</AtlasData>