
Introduction
This document describes how the InstantAtlas Access Data Manager is used to generate data files for InstantAtlas stand-alone dynamic reports. It is supplied in conjunction with an Access Data Manager that contains example data. The reader may find it useful to refer to the example data in the Access Data Manager.
The Access Data Manager is aimed at users with basic Access skills. The advantage of the Access Data Manager over the Excel Data Manager is that you can store all the data in a relational database. You can then create different reports with sub selections of the stored data i.e. you can choose the base geography that you like and also decide on just specific themes and associate columns to include into your data file(s).
Installation and Setup
The Access Data Manager is a Microsoft Access 2003 database. Users will require Microsoft Access in order to use the database and rights to open a database that contains executable code.
You can download the InstantAtlas Access Data Manager here. Please unpack the zip archive and ensure that the containing MS Access file is saved to a location accessible by the user.
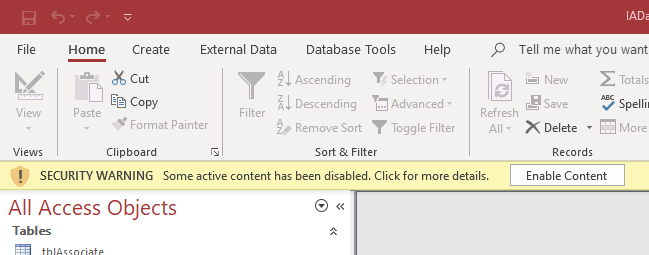
![]() Note that you may see a security warning below the Access ribbon after opening the Access file. You should click ‘Enable Content’ to be able to use the programming code contained in the Access Data Manager.
Note that you may see a security warning below the Access ribbon after opening the Access file. You should click ‘Enable Content’ to be able to use the programming code contained in the Access Data Manager.
Loading Data into the Access Data Manager
Setting up the Geography
Definitions of the different geographies in InstantAtlas are given below.
Base geography: The set of geographic features that you wish to produce a thematic map for. For example, if you have crime statistics for post code sectors in Edinburgh and you wish to make a thematic map of these, the base geography for your InstantAtlas report will be Edinburgh post code sectors.
Contextual geographies: These are optionally displayed in dynamic reports as overlays to the base geography to provide context for the map(s). They are not used for thematic mapping as this role is reserved for the base geography. If for example you publish a report with Edinburgh post code sectors as the base geography, you might include post code districts (a higher-level postal geography) as a contextual geography.
Comparison geography: Any geography that you want to treat as a comparator in your dynamic reports. Comparator values are not shown in the map(s) of a dynamic report, but they are displayed in a separate comparison geographies table.
Because both base geography and comparison geographies have data values attached to them, they must be entered into your Access Data Manager. They are defined using two tables:
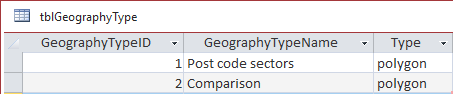
tblGeographyType
This table should hold an entry for each of the geographies you are holding indicator data for, whether they are intended for use as a base geography or comparison geography (or both). For each geography you should enter a ‘GeographyTypeID’, ‘GeographyTypeName’ and the type of the geography (either polygon, point or line). Each ‘GeographyTypeID’ must be unique.
tblGeography
This table holds a list of all individual geographic features included in your base and comparison geographies. Every feature must have a ‘GeographyID’, a ‘GeographyName’ and ‘GeographyTypeID’ (i.e. the geography type to which the geographic feature belongs). The ‘GeographyID’ values must be unique. The ‘GeographyTypeID’ must be consistent with the ‘GeographyTypeID’ in ‘tblGeographyType’. The ‘GeographyID’ must be the same as that used in the digital map file (ESRI shapefile or MapInfo interchange file) used to supply the geographic features. Note that the ‘GeographyID’ will be treated as text.
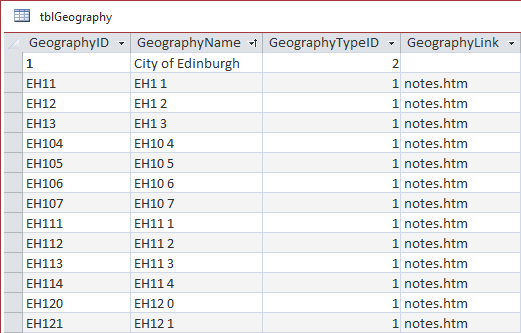
Optionally you can supply a ‘GeographyLink’ for each feature. This is the link to the file that should open when the Notes icon for a geographic feature is clicked in the data table of a dynamic report. Each link can be different and if you do not supply a link, the Notes icon will not appear in the data table of the dynamic report. In the example above, the Notes icon for each post code sector will link to a file called notes.htm located in the same folder as the dynamic report. For example, you could replace notes.htm by ‘C:\profile.pdf’ or ‘../../profile.pdf’ or ‘http://www.instantatlas.com’ to link to a different resource.
Setting up Filters
If you wish to use filters in your InstantAtlas reports, you will need to create entries in the following two tables:
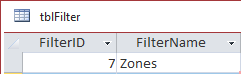
tblFilter
This table simply lists the filters in the Access Data Manager. Supply a ‘FilterID’ and a ‘FilterName’ for each filter. The ‘FilterID’ values should be unique.
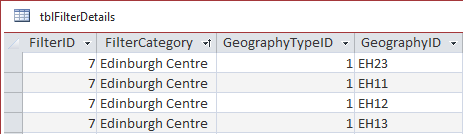
tblFilterDetails
This table defines the filters in terms of the ‘FilterID’ (from ‘tblFilter’), a filter category or value, and the geographic features associated with the category. This is a list by feature (defined by ‘GeographyTypeID’ and ‘GeographyID’) with associated ‘FilterID’ and ‘FilterCategory’.
Setting up Splits
Split information in the Access Data Manager allows you to split the data creation process so that data files are created for multiple dynamic reports. For example, rather than having a dynamic report displaying all post code sectors in Edinburgh you might wish to publish a series of reports with each displaying the post code sectors in a different zone (e.g. East Edinburgh, West Edinburgh, etc). If you wish to split a geography, then you will need to create entries in the following two tables:
tblSplit
This table simply lists any splits you wish to use. Supply a ‘SplitID’ and a ‘SplitName’. The ‘SplitID’ value should be unique. The split name is not displayed in dynamic reports.

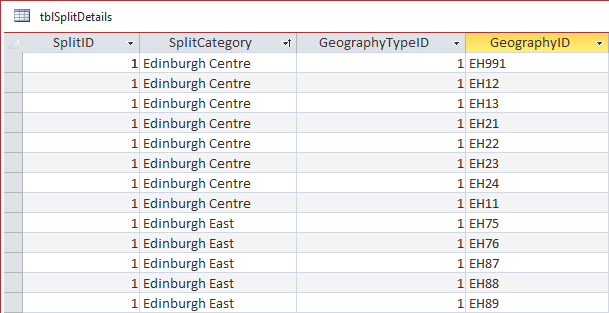
tblSplitDetails
This table defines how the geographic features in a geography are split. Splits are defined in terms of the ‘SplitID’ (from ‘tblSplit’), a split category or value, and the geographic features associated with the split category. This is a list by feature (defined by ‘GeographyTypeID’ and ‘GeographyID’) with associated ‘SplitID’ and ‘SplitCategory’. The ‘SplitCategory’ is used to name data files created by the Access Data Manager and therefore should not contain characters that cannot be used in a filename (e.g. a colon or a slash).
Setting up the Data Structure (Themes / Indicators / Time Periods)
The data in InstantAtlas reports must be organised using three levels: theme, indicator and instance/date. There are three different tables in which you need to define the structure of your data:
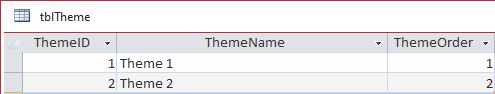
tblTheme
For each theme you should provide a ‘ThemeID’, ‘ThemeName’ and optionally a ‘ThemeOrder’. ‘ThemeID’ values must be unique. You can use ‘ThemeOrder’ to define the order in which themes will be listed in the Data drop down list of your InstantAtlas report. If you do not define any ‘ThemeOrder’ values, your themes will be listed alphabetically in your report.
tblIndicator
For each indicator you should provide an ‘IndicatorID’, ‘IndicatorName’ and optionally an ‘IndicatorOrder’. You can use ‘IndicatorOrder’ to define the order in which indicators will be listed within the theme they belong to in the Data Explorer of your dynamic report. If you do not define any ‘IndicatorOrder’ values, your indicators will be listed alphabetically in your report. The theme to which the indicator relates must also be supplied – an indicator can only be related to a single theme. The indicator type must be supplied – either ‘numeric’ or ‘categoric’.
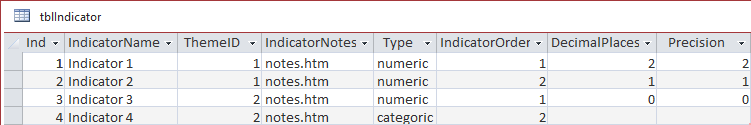
If you wish to link to an external file containing supporting information for a particular indicator, the link to the file should be supplied in the ‘IndicatorNotes’ field. This link is used when the Notes icon in the Data Explorer of a dynamic report is clicked for a particular indicator. In the example below, the Notes icon for post code sectors will link to a file called notes.htm located in the same folder as the dynamic report. A different link can be provided for each indicator. For example, you could specify a link of ‘C:\profile.pdf’ or ‘../../profile.pdf’ or ‘http://www.instantatlas.com’.
For ‘numeric’ type indicators you can specify the number of decimal places that will be exported into the JSON files and the precision that you would like to see in the report for this indicator. These values can be different. If you do not specify a value in the DecimalPlaces column the JSON file(s) will contain all decimal places that you put into the tblData table. If these values are originally results of calculations, they might have many decimal places which will increase the size of your JSON file and can potentially affect the performance of your report. The precision setting simply defines the number of decimal places that are displayed in your report regardless of how many decimal places are exported into the JSON file. Both settings follow the rules of rounding.
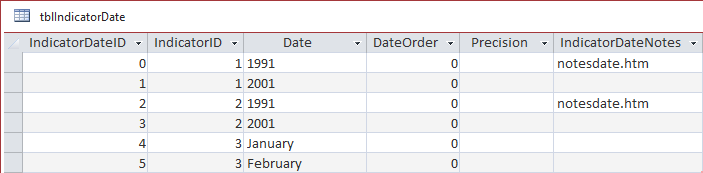
tblIndicatorDate (for indicators with time series data)
For each indicator that has data for more than one time period you should enter every possible combination of ‘IndicatorID’ and ‘Date’, supplying a unique ‘IndicatorDateID’ value for each combination. Note that ‘Date’ is currently simply 50 text characters allowing you to enter dates as you see fit. You can optionally supply ‘DateOrder’ values to define the order in which time periods will be listed in the Data Explorer of your dynamic report. If you do not define any ‘DateOrder’ values, your time periods will be listed in ascending order in your report. Optionally you can also set the precision of the data values at a date level. These settings will overwrite the precision setting of the indicator. In a similar way you can specify a Notes link for an individual date in the ‘IndicatorDateNotes’ column. These settings will overwrite the ‘IndicatorNotes’ setting of the indicator.
Loading the Data
You can load the data into the Access Data Manager in all the usual ways (import, attach table, copy and paste from Excel, etc). It is assumed the user has experience of loading data into an Access database.
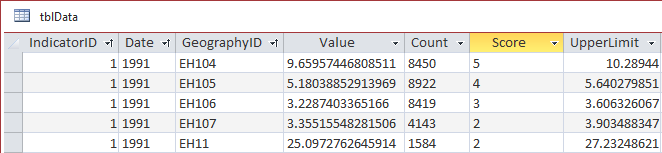
tblData
This table stores all indicator data values and any associated values. The required fields are ‘IndicatorID’, ‘GeographyID’ and Date if you defined one or more in the tblIndicatorDate table. Together these three fields define an individual display record for your InstantAtlas report.
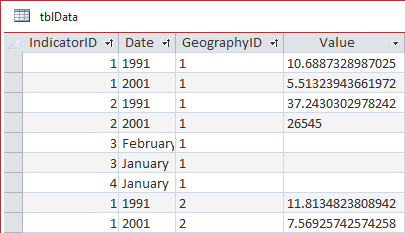
![]() Note: You need to make sure that each Indicator with Dates is included in the tblIndicatorDate table and that the combinations that you define there, match with the data you put into the tblData. Data values are held in one or more of the following fields depending upon which associates you want to use in your report.
Note: You need to make sure that each Indicator with Dates is included in the tblIndicatorDate table and that the combinations that you define there, match with the data you put into the tblData. Data values are held in one or more of the following fields depending upon which associates you want to use in your report.
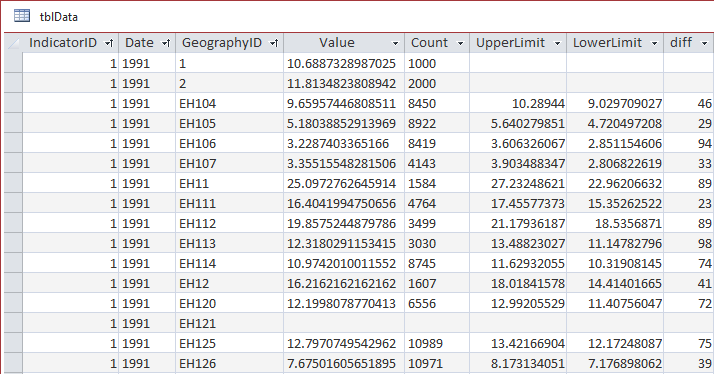
The value field holds indicator values. Any other fields hold associate values, so called because they are associated to indicator values. Associate values are not used in thematic mapping in InstantAtlas reports but perform other roles. The inclusion of associate values is optional, but the default configuration of some templates assumes that you will be supplying certain associates.
| Field | Description |
| Value | This field contains indicator values that will thematically mapped in a dynamic report. These are stored as text so that you can enter text values for categoric type indicators. |
| Count | This field is an example for an associate that you might want to include when you map rates. By default, you will not see these values in the report. You will need to include a Count column into the Data Table using the Designer. Please refer to the Designer section of the IA Desktop User Guide for information on how to do this.
Note that if you are creating data files for loading into InstantAtlas Server you do not need to populate this field – you should be putting your counts into the numerator field instead. |
| UpperLimit | This field contains any upper confidence limits associated with your indicator values. You can calculate these limits using any method you wish and including limits is optional. If you do include limits, they will be displayed as error bars in the bar chart of a dynamic report. |
| LowerLimit | This field contains any lower confidence limits associated with your indicator values. You can calculate these limits using any method you wish and including limits is optional. If you do include limits, they will be displayed as error bars in the bar chart of a dynamic report. |
| diff | This associate is used by default to draw the horizontal bars in an Area Profile – Spine Chart report. |
Some templates or components may require other associates:
| Associate | Reason for including in your data JSON file(s) |
| largestObservation, upperQuartile, median, lowerQuartile, smallestObservation | These associates need to be provided if you would like to use the box-and-whisker chart in your report. This chart can be included in the Single Map template using the Designer. |
| number, significance, baseline, state, trend, target | These associates perform various roles in the Area Profile template. For more information please refer to the Area Profile section of the InstantAtlas Desktop User Guide. |
| xValue, yValue, sizeValue, numerator, denominator | These associates perform various roles in the Bubble Plot template. For more information please refer to the Scatter Plot section of the InstantAtlas Desktop User Guide. |
Please note that ‘numerator’ and ‘denominator’ are included in the Access Data Manager as associates. These cannot be deleted as they were required to export data for our legacy product InstantAtlas Server. You can either leave them empty or use them if you want to set up numerator and denominator associates (e.g. for the Bubble Plot template).
Please refer to section ‘Adding New Associates’ of this guide for information on how to include further associates into the Access Data Manager.
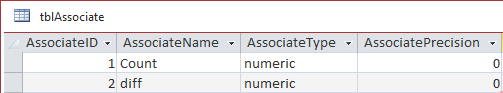
tblAssociate
Associate columns by default get exported into the JSON file(s) as type categoric, regardless of what data type is defined for this column in the table tblData (which means the values will be sorted alphabetically and will appear left aligned in the data table). To change the type of an associate or to set the precision of associate values you need to define this in the table tblAssociate.
tblIndicatorAssociate
If you need to define the data type and/or precision for an associate where these settings need to be different depending on the selected indicator, you can use the table tblAssociate to enter these settings.
Defining the Template for the JSON Export
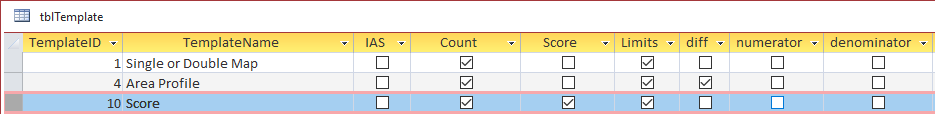
tblTemplate
The Access Data Manager enables you to create JSON files for dynamic reports by using only a subset of the data you store in the Access Database. To define which associates shall go into the JSON files you can set up templates in the table tblTemplate.
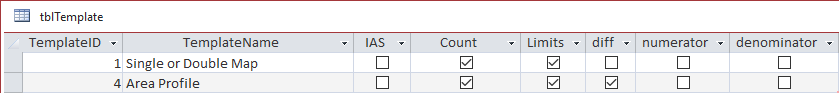
By default, there are already two templates defined. The template called ‘Single or Double Map’ will include only the associates Count, UpperLimit and LowerLimit (which are combined to ‘Limits’ in the tblTemplates since they are not supposed to exist separate from each other). The template called ‘Area Profile’ has additionally the diff column included. If you are using the numerator and denominator associates you may want to tick the relevant boxes to include them in the template of your choice. The first column IAS can be ignored and left unticked – this setting was required when exporting data for our legacy product InstantAtlas Server.
Adding New Associates
You can add your own new associate values (text or numbers) if you wish. These associate values can be displayed in custom columns in the main data table of an InstantAtlas dynamic report. For example, you may have an indicator called ‘Percentage of the population who are visually impaired’. You might also have an average score in a vision test which you wish to associate to the indicator value. The score associate values could then be shown in the data table alongside the indicator values themselves.
You can also use associates to populate the Advanced Pie Chart.
To display new associate values in an InstantAtlas report, there are two distinct steps:
- Creating a data file that contains the new associate values for one or more indicators
- Configuring the dynamic report to implement the new associate values.
Step 2 is carried out using the InstantAtlas Designer and is therefore beyond the scope of this document. Please refer to the Designer section of the InstantAtlas Desktop User Guide. Step 1, however, is carried out using your InstantAtlas Data Manager.
To add new associate values, you will need to create new table fields in the Access Data Manager and populate these with values. You need to complete the following steps:
Step 1: Update the structure of the ‘tblData’ table by adding the custom fields as required and fill them with data.
If the new associate should not be categoric, include a new entry in the table tblAssociate to define type and precision.
Step 2: Update the ‘Data’ query to include the custom fields.
Step 3: Update the structure of the ‘tblTemplate’ table by adding the same custom fields.

Step 4: In the ‘tblTemplate’ table either tick the box of the new custom field in one or more of the existing template entries or create a new entry with the same default entries as the template you are enhancing and check the boxes for the new custom fields.
Once you have completed these steps you may run the data file creation process using your enhanced template.
As mentioned above, new associate values will not be displayed in InstantAtlas reports by default.
Adding Metadata
You can add properties to geographies, themes and indicators by populating the tblMetadata table. You will need to populate this table if you want to do the following:
- Adding metadata that will be displayed in a text box
- Setting custom legends
- Setting the chart axis minimum and maximum
- Create data files for a Performance Analysis, a Bubble Plot (Simple Configuration) or a Funnel Plot report. Please refer to the respective sections in the InstantAtlas Desktop User Guide for the list of properties that must be supplied.
The tblMetadata table consists of 4 fields:
ElementType – this should be ‘Theme’, ‘Indicator’ or ‘IndicatorDate’
ElementID – this is the respective ‘ThemeID’, ‘IndicatorID’ or ‘IndicatorDateID’ to which the metadata relates
PropertyName – the name of the property e.g. ‘metatext’, ‘customColours’, etc
PropertyValue – the value of the property e.g. ‘This is an example text for Indicator 1’
You may have as many properties as you like per theme, indicator or time period.
Adding Metatext
You can define metadata that will be displayed in a text box for themes, indicators or time periods. The format for entering this is shown below.
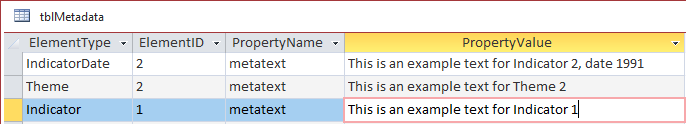
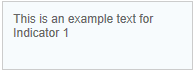
Column C must contain ‘metatext’. Column D should contain the text that you wish to appear in the report text box (or text boxes in the case of a report published using the Double Map template or Double Map Time Series template). The following image shows how this metatext would look in a text box in a report. Note that the text boxes are added to a report using the InstantAtlas Designer (usually they are in the report layout by default) and that their size and position is configurable. Note that HTML can be used to format text in this way.
Setting Custom Legends
It is also possible to set custom classifications for individual themes, indicators or time periods. You can also set custom colours and labels for the display of the custom classification within a dynamic report. Furthermore, you can define that a theme, indicator or time period appears with a specific legend classifier or legend palette by default.
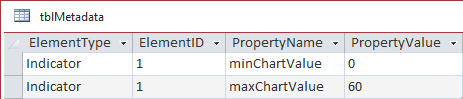
The following image shows a screenshot of the tblMetadata table in an instance of the Access Data Manager. A custom classification is set up for the Indicator with ID 1 which is a numeric indicator and for the Indicator with ID 4 which contains categoric values. The default legend classifier for the Indicator with ID 2 is set to Equal Interval and the default legend palette for this indicator will be the one called ‘Sequential Green Yellow’ in the config.xml file.
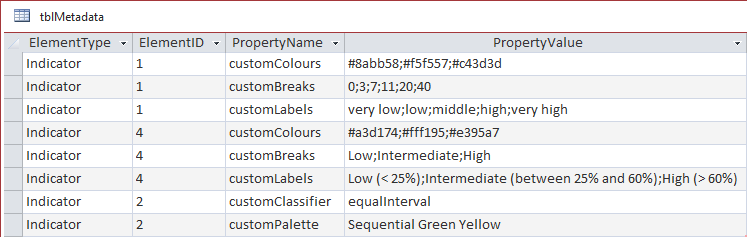
You can see from the screenshot that the custom classification for both indicators (ids 1 and 4) is made up of three separate custom properties: customColours; customBreaks and customLabels.
customColours
Use this property to set the colours for displaying individual classes or to set a colour ramp. If the number of customColours matches the number of classes in the custom classification, then the colours will be displayed for each class in the same order in which you enter them in the worksheet. You can set just two colours and the dynamic report will create a colour ramp between them for as many classes as you have chosen.
customBreaks
Use this property to set the breaks between different classes. You should set one more value than the number of classes that you require i.e. if you want 5 classes you need to enter 6 values for breaks. If you have categoric data, then you must use the exact text label used within the data.
Categoric breaks are case sensitive.
customLabels
Use this property to set the labels for each class that is displayed in the legend. The labels are applied in the order in which you enter them in the worksheet. You need to make sure that the number of labels matches the number of classes you have set up.
customClassifier
Use this property to set the default legend classifier for an indicator to one of the InstantAtlas standard classifiers. Valid values are ‘equalInterval’, ‘quantile’, ‘natural’, ‘continuous’, ‘standardDeviation’.
customPalette
Use this property to set the default legend palette for an indicator to one of the legend palettes that are defined the config.xml file. Valid values are the names of the palettes in the configuration file. To find these, open the config.xml file of your report in the Designer and click in the menu bar on ‘Style’ and then ‘Palettes’. In the ‘Palettes (numeric data)’ tab you can find the palettes names for numeric indicators and the tab called ‘Colour Schemes (textual data)’ will show you the names of the categoric palettes.
Setting the Chart Axis Minimum and Maximum
By default, the bar chart and time series chart adjust their minimum and maximum depending on the data the chart shows. This might not be suitable e.g. when using a time animation. To set the chart minimum and maximum to a fixed value for each theme or indicator you can use the metadata elements ‘minChartValue’ and ‘maxChartValue’.
Creating the Data File(s)
Data files for a report are generated using the following queries:
- Associate
- Data
- Filter
- FilterDetails
- Geography
- GeographyType
- Indicator
- IndicatorAssociate
- IndicatorDate
- Metadata
- Split
- SplitDetails
- Template
- Theme
Currently these are direct views onto the appropriate table. You can adjust these queries directly if you wish but this is an option to use with care. The fields in the queries must not be changed although they may be alternatively sourced. This method can also be used to create particular subsets of the data. If you do this it is important that the queries work consistently in terms of the subset of data to which they relate.
The final step is to create the data file(s) so they can be added to a dynamic report.
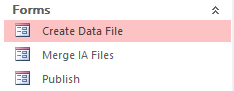
Step 1: Open the Create Data File form. In the Access Data Manager navigate to the Forms tab and double click the Create Data File form
![]() Note that you may need to click on ‘Enable Content’ if you see a Security Warning in a yellow bar underneath the Access ribbon. This will then allow the themes, comparison areas and filters to be available for export.
Note that you may need to click on ‘Enable Content’ if you see a Security Warning in a yellow bar underneath the Access ribbon. This will then allow the themes, comparison areas and filters to be available for export.
The Create Data File form will look similar to that displayed below.
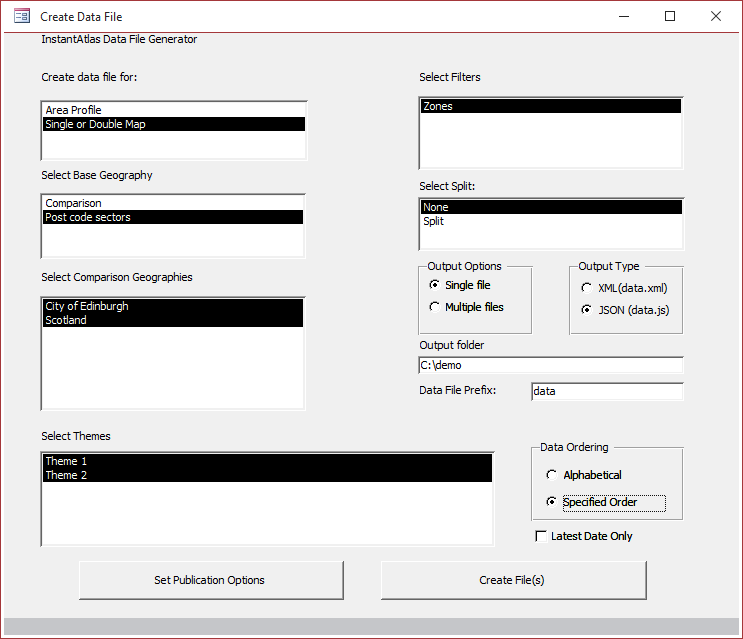
Step 2: Select the template option for which you wish to create data files.
Step 3: Select the base geography for your report. The base geography is the geography thematically mapped.
Step 4: If you wish to include comparison geographies, choose any features from the list of comparison geographies. Hold down ‘Ctrl’ on your keyboard to select multiple comparison features.
Step 5: Select the themes you wish to include. Hold down ‘Ctrl’ on your keyboard to select multiple themes. Note that if no themes are selected, the data file created will contain all themes.
Step 6: If there are filters available for your chosen base geography that you wish to include, select one or more filters from the filters list. Hold down ‘Ctrl’ on your keyboard to select multiple filters.
Step 7: If there are splits available for your chosen base geography and you wish to split the data file creation, select a split from the splits list.
Step 8: Select an output option:
Single file – if you don’t export a large amount of data you can export all into a single data.js file
Multiple files – you should select this option if you are creating data files with a lot of data. It is more efficient for a stand-alone dynamic report to hold data in multiple JSON files rather than one large data file. If this option is selected, the Access Data Manager will export the data structure into a data.js file but the actual data values are being saved into theme data files, one for each theme. The theme files are being linked to from the data.js file. As a result, the report will on start-up only load the data.js file and the theme file of the first theme instead of having to load all the data upfront.
Step 9: Select an output type:
JSON (data.js) – in most cases (except for those stated below) you should select this option.
XML (data.xml) – The XML format was historically used for Flash dynamic reports. It is still included for three reasons:
- For troubleshooting purposes as it is easier for the human eye to read an XML data file than a JSON data file. Additionally, even when the JSON format is selected, the code exports the data first to XML and converts it to JSON as a second step. Being able to stop that process at the XML format allows for easier debugging.
- To generate an HTML table view of your data by using the data-xml-2-html.xslt file. This file is part of every InstantAtlas dynamic report and converts the data.xml file to an HTML table view if it gets called via the browser URL.
- To be able to create multiple geography reports using the Batch Publisher.
Step 10: Specify the output folder by typing the path into the text field
Step 11: Choose the data file prefix. In most cases, this should be ‘data’.
Step 12: Select a data ordering option – either alphabetically or in the order you specified in the tables ‘tblTheme’ ‘tblIndicator’ and ‘tblIndicatorDate’.
Step 13: If you would like to include only the latest dates of each indicator into your report, e.g. in the spine chart of an area profile report, you should tick the ‘Latest Date Only’ option.
Step 14: If you would like to use the InstantAtlas Batch Publisher you can control the automated publication of InstantAtlas reports from your Access Data Manager. Click the ‘Set Publication Options’ button to open a form to input or modify your batch publication settings. If the ‘Publish’ setting is selected for one record in the tblPublish table, the Access Data Manager will launch a batch publishing process. If you do not want to use the Batch Publisher, you must ensure no ‘Publish’ setting in the tblPublish table is selected. Please refer to section ‘Batch Publication of Dynamic Reports’ below for more information on batch publishing.
Step 15: Click the ‘Create File(s)’ button. This will create the data file(s) for your report in the specified output folder, or ‘C:\temp’ if no output folder is specified. This will overwrite any file(s) with the same name already present. A message will be displayed to let you know when the file(s) has/have been generated.
Step 16: Assuming that the Batch Publisher option has not been used, the data file(s) generated should be moved into the relevant InstantAtlas report output folder if they have not already been saved there. When generating multiple JSON files, in addition to the data.js file there will be a set of supporting .js files: one for each theme. These will be named <Base Geography Name>-T<Theme number>.js. Please ensure that these theme data files are also saved in the report folder alongside the data.js file.
If the Batch Publisher option has been used, you should wait until the report(s) have been generated. You will know that report(s) have been generated when ZIP files appear in the specified output folder.
Merging Data Files for Multiple Geography Reports
Before reading this section it is assumed that you have already read the Multiple Geography Reports section of the InstantAtlas Desktop User Guide.
Export the data files for each geography separately in the normal way. Then open the ‘Merge IA Files’ form and enter a semicolon separated list of data.js files. This list needs to be in the same order as the respective base geographies defined in the “Choose Your Base Geography” screen of the Publisher. Then enter the path and name of the merged file.
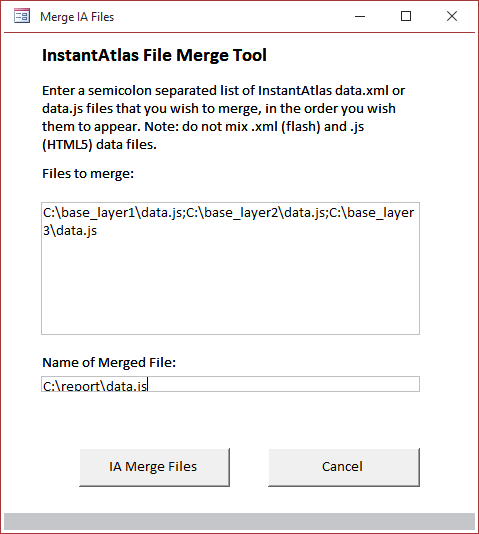
Click on the ‘IA Merge Files’ button to merge the listed data.js files together. The resulting file will be saved into the location you entered.
Batch Publication of Dynamic Reports
The Publish Form
With the InstantAtlas Batch Publisher you have the option to automate the publication of dynamic reports. This process is controlled using settings specified in the ‘tblPublish’ table. You can use the ‘Publish’ form to input or modify the settings in this table.
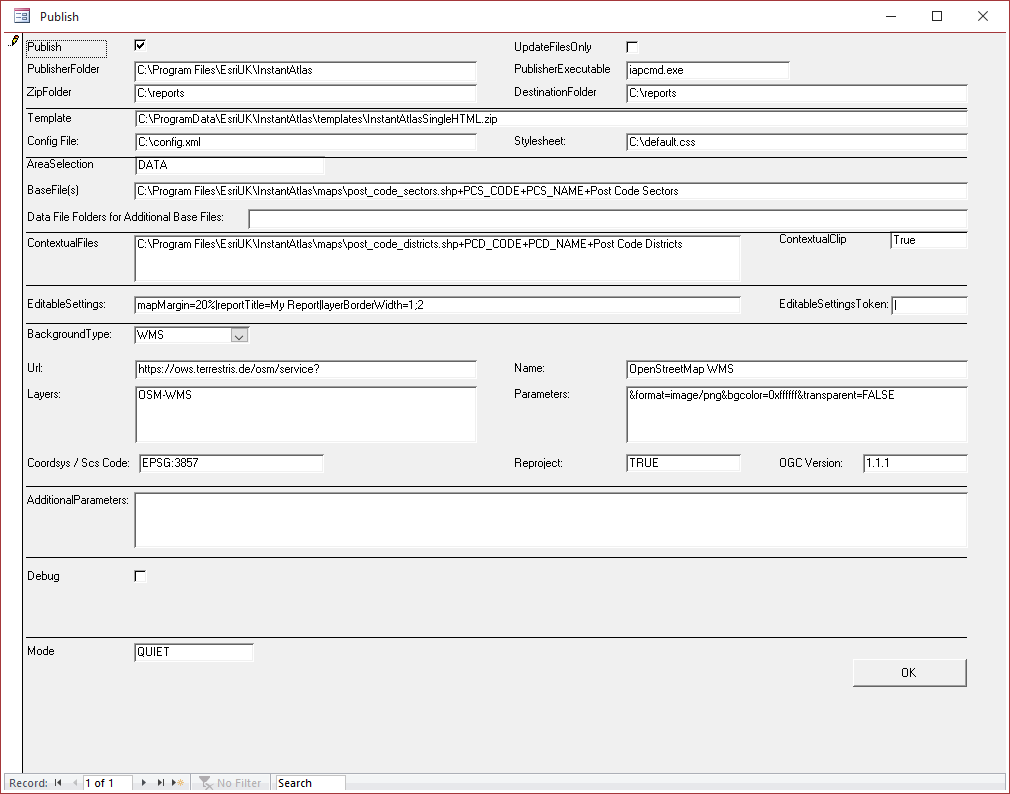
The Batch Publisher settings are described below:
Publish: Make sure this box is selected for the set of Batch Publisher options you wish to use. Ensure that only one set of Batch Publisher options is selected.
Update Files Only: this should be left blank if you wish to Publish a new set of reports. If you only want to update the data files in a set of already published reports, you should set this property to „Yes‟. The data files will be saved into subfolders of the destination folder if these subfolders have the same name as the split values.
Publisher Folder: the full pathname for the folder in which the command line interface publisher executable (iapcmd.exe) is located. In this example this is ‘C:\Program Files\EsriUK\InstantAtlas’.
Publisher Executable: the name of the command line version of the Publisher. This should always be ‘iapcmd.exe’
Zip Folder: the full pathname for the folder in which you want the zipped reports to be saved. In this example this is ‘C:\reports’.
Destination Folder: optionally you can enter the full pathname for the folder to which you want the zipped reports to be unpacked to. This can be the same folder as that specified for the ‘Folder for Zip File’ setting. If you do not enter a pathname, the zipped reports will not be unpacked. In this example this is ‘C:\reports’.
Template: the full pathname for the template you wish to use. The templates are archives (zip) located in the ‘templates’ folder which was created as part of your InstantAtlas installation. The default location of this folder is:
C:\ProgramData\EsriUK\InstantAtlas\templates
In the Access file we have used the following location:
‘C:\ProgramData\EsriUK\InstantAtlas\templates\InstantAtlasSingleHTML.zip’
Config File: optionally you can enter the full pathname for a custom configuration file (config.xml) that you wish to be used for the published reports. If you do not enter a pathname, the template default configuration file will be used. In this example this is ‘C:\config.xml’.
Stylesheet: optionally you can enter the full pathname for a custom style sheet (default.css) that you wish to be used for the published reports. If you do not enter a pathname, the template default style sheet will be used. In this example this is ‘C:\default.css’.
Area Selection: This should be set to ‘DATA’ if you wish the reports to only include the base geography features which are part of the respective split value. If you wish to display a map for all the areas of the base geography map file (not just for those that will show data in your report) use ‘BASE’.
Base File(s): This setting is made up of:
- the full pathname for the digital map file (ESRI shape file, MapInfo MID/MIF, MapInfo TAB file) containing the base geography for the series of reports you wish to publish,
- the feature code field in your base geography digital map file (note that this field is case sensitive and that the codes of your digital map file must be exactly the same as those in column A of the Geography and Filters worksheet),
- the feature name field in your base geography digital map file (note that this field is case sensitive) and
- optional – the label for the base geography that will be displayed in the legend of your published reports. If you do not specify a label, the layer will be shown in the legend with its original map file name.
These parameters must be delimited by a ‘+’ sign.
In this example the selected digital map file is an ESRI shape file called ’post_code_sectors.shp’ that contains post code sector boundaries for Edinburgh. This file is saved onto your computer during the installation of InstantAtlas.
The default location is C:\Program Files\EsriUK\InstantAtlas\maps
ESRI Shapefiles have a .shp file extension (e.g. districts.shp). MapInfo interchange (also referred to as MID/MIF) files have a .mif file extension (districts.mif). MapInfo Table files (TAB files) have a .tab extension (districts.tab). All are accompanied by supporting files. You must have a digital map file in one of these formats to be able to publish a dynamic report (a .shp .mif or .tab file). You will also need a .dbf file with the same name as the .shp file (districts.dbf) or a .MID file with the same file name as the .MIF file (districts.MID). For TAB files, you will need a range of other supporting files including .DAT, .ID, .MAP and .IND. These files need to be located within the same folder as the digital map files. Supporting files should all be supplied with either your Shape, MID/MIF or TAB files by the provider of your digital map data.
The field in the chosen digital map file (post_code_sectors.shp) that contains codes is called ‘PCS_CODE’. The names are stored in the field called ‘PCS_NAME’.
The label for the legend shall be ‘Post Code Sectors’.
Connecting these parameters together using the ‘+’ sign results in:
C:\Program Files\GeoWise\InstantAtlas\maps\post_code_sectors.shp+PCS_CODE+PCS_NAME+Post Code Sectors
If you wish to create reports with more than one base geography layer, please refer to section ‘Creating Multiple Geography Reports‘.
Data File Folders for Additional Base Files: Leave this property blank if you wish to create reports with just one base geography layer. You will only need this property if you want to create Multiple Geography Reports using the Batch Publisher. Please refer to section ‘Creating Multiple Geography Reports‘.
Contextual Files: optionally you can enter the full pathnames to any contextual layers you wish to include in your reports. For each contextual geography you must supply the following:
- The full pathname for the digital map file (Shapefile, MID/MIF or TAB)
- The feature code and name fields in the digital map file
- The label for the contextual geography that you wish to be displayed in the Map Layers list of the published reports
This information should take the form of a semi-colon delimited list. For each contextual geography, information should be delimited by a ‘+’ sign.
In this example a single contextual layer has been entered as ‘C:\Program Files\EsriUK\InstantAtlas\maps\post_code_districts.shp+PCD_CODE+PCD_NAME+Post Code Districts’. The digital map file is an ESRI shape file called ‘post_code_districts.shp’. The feature code and name fields in this digital map file are called ‘PCD_CODE’ and ‘PCD_NAME’ respectively. The label for the contextual geography that will be displayed in the published reports is ‘Post Code Districts’.
If you wanted to add a digital map file with Local Authorities as a second contextual geography, your entry might look like this:
‘C:\Program Files\EsriUK\InstantAtlas\maps\post_code_districts.shp+PCD_CODE+PCD_NAME+Post code districts;C:\local_authorities.shp+LA_CODE+LA_NAME+Local Authorities’
Contextual Clip: this field should be set to ‘True’ if you wish to include only contextual geography features that overlap the base geography. If you wish to include all contextual geography features, you should set this to ‘False’.
Editable Settings: optionally you can enter a list of editable settings. As a delimiter you need to use the character defined in the ‘Editable Settings Token’ property. In the example workbook the map margin is set to be 20%, the report title is ‘My Report’, the border width of the base layer is 1px the contextual layer has a border width of 2px.
This is a list of available editable settings:
| Editable Setting | Example |
| mapMargin | mapMargin=20% |
| Description: Sets the distance between the border of the map component and the base layer.* | |
| reportTitle | reportTitle=My Report |
| Description: Changes the title of the atlas.html page. The title is displayed in the title bar of your browser and in the browser tab. | |
| layerVisible | layerVisible=true;false;true |
| Description: A semi-colon delimited list of ‘true’ or ‘false’ values to set if the map layers are visible in the map by default. The first value defines the visibility of the base layer followed by the visibility settings for the contextual layers in the same order as defined in the ‘Contextual Layer’ property. | |
| baseLayerSymbolSize | baseLayerSymbolSize=18 |
| Description: Sets the size of the legend symbols for the base layer. Does not apply when proportional points or lines are used. Max and min sizes for proportional symbols can be set in the Designer. | |
| contextualLayerSymbolSize | contextualLayerSymbolSize=12;15 |
| Description: A semi-colon delimited list of pixel values to set the size of the legend symbols for the contextual layers. | |
| baseLayerFillOpacity | baseLayerFillOpacity=0.7 |
| Description: Sets the opacity for the base layer. 0 means totally transparent and 1 means totally opaque. | |
| contextualLayerFillOpacity | contextualLayerFillOpacity=0;1 |
| Description: A semi-colon delimited list of opacity values for the contextual map layers in the same order as defined in the ‘Contextual Layer’ property. 0 means totally transparent and 1 means totally opaque. | |
| baseLayerFillColor | baseLayerFillColor=#cccccc |
| Description: Sets the fill colour in hexadecimal format for the base layer. This colour appears when a feature is not part of the legend classification, e.g. when it is not part of an applied filter. | |
| contextualLayerFillColor | contextualLayerFillColor=#ffcc00;#0000ff |
| Description: A semi-colon delimited list of fill colours in hexadecimal format for the contextual map layers in the same order as defined in the ‘Contextual Layer’ property. | |
| layerBorderThickness | layerBorderThickness=1;1.5;2 |
| Description: A semi-colon delimited list of pixel values for the digital map layers. The first value defines the border thickness of the base layer followed by the border thickness settings for the contextual layers in the same order as defined in the ‘Contextual Layer’ property. | |
| contextualLayerBorderColor | contextualLayerBorderColor=#ffcc00;#0000ff |
| Description: A semi-colon delimited list of border colours in hexadecimal format for the contextual map layers in the same order as defined in the ‘Contextual Layer’ property. | |
| baseLayerBorderColor | baseLayerBorderColor=#000000 |
| Description: Sets the border colour in hexadecimal format for the base layer. | |
| layerShowLabels | layerShowLabels=false;false;true |
| Description: A semi-colon delimited list of ‘true’ or ‘false’ values to set if labels should show in the map for the map layer features. The first value defines the visibility of feature labels for the base layer followed by the visibility of feature labels for the contextual layers in the same order as defined in the ‘Contextual Layer’ property. | |
| layerMinLabelExtent | layerMinLabelExtent=0;0;10000 |
| Description: A semi-colon delimited list of minimum label extents in map units for the map layers. The first value defines the minimum label extents for the base layer followed by the minimum label extents for the contextual layers in the same order as defined in the ‘Contextual Layer’ property. For layers which are not supposed to show labels (layerShowLabels=false), the layerMinLabelExtent value can be left blank. | |
| layerMaxLabelExtent | layerMaxLabelExtent=1000000;1000000;500000 |
| Description: A semi-colon delimited list of maximum label extents in map units for the map layers. The first value defines the maximum label extents for the base layer followed by the maximum label extents for the contextual layers in the same order as defined in the ‘Contextual Layer’ property. For layers which are not supposed to show labels (layerShowLabels=false), the layerMaxLabelExtent value can be left blank. | |
| baseLayerShowDataTips | baseLayerShowDataTips=true |
| Description: Sets if the base layer features should show data tips when hovered with the mouse. | |
| contextualLayerShowDataTips | contextualLayerShowDataTips=true;false |
| Description: A semi-colon delimited list of ‘true’ or ‘false’ values to set if the contextual layer features should show data tips when hovered with the mouse. To be set in the same order as defined in the ‘Contextual Layer’ property. | |
| baseLayerShowInLayerList | baseLayerShowInLayerList=true |
| Description: Sets if the base layer should appear in the legend. | |
| contextualLayerShowInLayerList | contextualLayerShowInLayerList=false;true |
| Description: A semi-colon delimited list of ‘true’ or ‘false’ values to set if the contextual layers should appear in the legend. To be set in the same order as defined in the ‘Contextual Layer’ property. | |
| contextualLayerIconPath | contextualLayerIconPath=C:\icon.png |
| Description: A semi-colon delimited list of paths to icon files which the map shall display for contextual point layers instead of the default circle. To be set in the same order as defined in the ‘Contextual Layer’ property. | |
* Possible values for map margins are: none, 1%, 2%, 5%, 10%, 20%, 30%, 40%, 50%, 60%, 70%, 80%, 90% and 100%. If you use Google Maps as a background layer, we suggest you use ‘none’ since the map will adjust itself to one of the zoom levels provided by Google maps.
Editable Settings Token: This character should be used as a delimiter between multiple Editable Settings. In the example the token is a pipe symbol (‘|’)
Background Type: Please select here the type of background layer you wish to include into your reports. The options are:
- ‘None’ (if you do not want to include any background mapping)
- ‘ArcGIS’ (for an ArcGIS Server/ ArcGIS Online connection)
- ‘Google’ (for Google Maps)
- ‘Raster’ (for a raster background image collection locally saved on your computer or a shared drive)
- ‘WMS’ (for a Web Map Service)
Depending on which option you chose, you will see different settings to specify your background mapping.
Using a Raster Image Collection as a Background Layer
Folders: Here you can enter the full pathnames to any background mapping index files (xml).
In this example this is ‘C:\Program Files\EsriUK\InstantAtlas\images \UK_Miniscale_XYZ.xml’.
If you wanted to add a second index file, your entry might look like this:
‘C:\Program Files\EsriUK\InstantAtlas\images\UK_Miniscale_XYZ.xml;C:\Program Files\EsriUK\InstantAtlas\images\os250k.xml’
Copy: This field should be set to ‘True’ if you wish background mapping images to be copied to the output folders of the published reports. Note that images files will only be copied over if they are located in the same folder as the index files. If you do not wish background mapping images to be copied to the output folders of your published reports, set this to ‘False’.
Clip: This field should be set to ‘True’ if you wish to display only background images that overlap the base geography in your published reports. To display all background images, set this to ‘False’.
Using a Web Map Service as a Background Layer
Url: Here you can include a Web Map Service as a background mapping. Therefore, type the URL for the WMS into this field. In the example Access file, a connection to the OpenStreetMap WMS from ‘terrestris’ in the Germany is used. If you wish to use this WMS, please ensure you read the guidance notes at https://www.terrestris.de/en/openstreetmap-wms/.
Name: The name of the WMS layer as it will appear in the legend of your report. In the example this is ‘OpenStreetMap WMS’.
If you don’t know the values for the following settings, you might want to request the properties of the WMS with the GetCapabilities request. Therefore, type into the URL field of your internet browser the URL of the WMS you want to use followed by ‘&REQUEST=GetCapabilities’. This will offer you a file in xml format with the properties of the WMS including coordinate system, version number, available image formats and available layers.
Layers: A comma delimited list of WMS layers you want to include.
Parameters: Parameters for image format, background colour and transparency. The parameter names are ‘format’, ‘bgcolor’ and ‘transparent’ and they must have an ampersand (‘&’) as a prefix. In the example Access file, we have chosen:
‘&format=image/png&bgcolor=0xffffff&transparent=FALSE’
Coordsys / Scs Code: This is the coordinate system of the WMS. For the WMS from terrestris this is ‘EPSG:3857’
OGC Version: The version number of the WMS. For the terrestris WMS this is ‘1.1.1’
Using an ArcGIS Server/ArcGIS Online connection as a
Background Layer
The properties Url, Name, Layers, Coordsys / Scs Code and Parameters should be used respectively as explained for the WMS background layer. As an example you could use:
Url: https://server.arcgisonline.com/ArcGIS/rest/services/World_Street_Map/
MapServer/export?
Name: ArcGIS Layer
Layers: 0
Coordsys / Scs Code:102100
This example shows the settings for the ArcGIS World Street Map connection in the coordinate system Web Mercator Auxiliary Sphere (102100). This connection contains a single layer which is called ‘0’.
Using Google Maps as a Background Layer
Map Type: This is where you can set the default Google Map type that loads with the report. Settings include ‘normal’ (for street map), ‘satellite’, ‘hybrid’ or ‘physical’ (for terrain). The end-user can switch between these map types via a drop-down list in the map component.
In the example the hybrid map type is chosen.
API Key: For Google Maps to work on a web server, you will need to provide an API (Application Programming Interface) Key. Please refer to the Google Maps API documentation on how to obtain an API key. For use on a local drive you do not need an API key.
Layer Name: The name of the Google Maps layer as it will appear in the legend of your report. In this example it is called ‘Google Maps’.
Reproject: For a Google Maps background to work, all map layers need to be in the same projection as Google Maps. This projection is called Web Mercator Auxiliary Sphere. If you wish the Batch Publisher to re-project your map layers for you set this property to ‘True’. If your map layers are already in the same projection as Google Maps, you should set this property to ‘False’. Please refer to section ‘Google maps in InstantAtlas reports’ of the InstantAtlas Desktop User Guide for important information on the re-projection functionality and its limitations. Since the demo map files for Edinburgh post code sectors and districts are not in the Google Maps projection, this property is set to ‘True’ in the example.
Additional Parameters: This is a place holder for any additional parameters that you might want to include into your batch reports. Please leave this blank unless you are told otherwise by your support provider.
Debug: If you wish to debug the batch publication process you should select this option. When you next try and run batch publish a command will appear in the ‘CommandLine’ box. Copy the contents of this box into your clipboard (Ctrl + C)
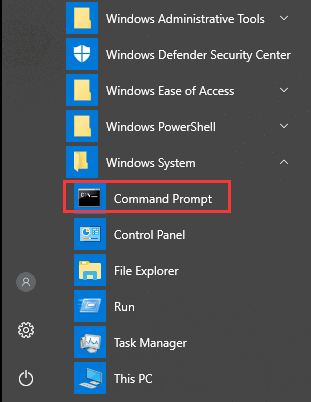
Now access a command prompt.
You can find the Command Prompt in your Windows Start Menu in the ‘Windows System’ folder.
Paste the command line by right clicking and selecting paste. Hit enter to execute.
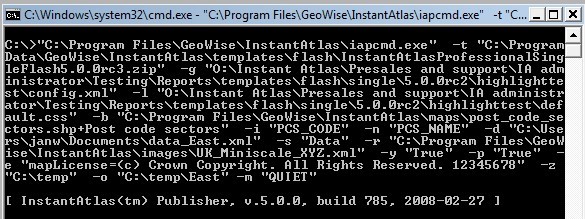
The error message will now stay in the DOS prompt screen. You can read
this error message and use it to debug the batch publisher, or if required,
copy the message to your support provider. To do this, right click on the
window, select all, and then copy and paste the error message into an
e-mail. Send the error message, along with any comments you may have, to your
support provider.
Mode: Set to ‘QUIET’ or ‘VERBOSE’ depending on the amount of
information you wish to view during the publishing process.
The Publishing Process
Once you have edited the above settings and ensured that you have the checkbox of the ‘Publish’ property ticked, click ‘OK’ in the Publish form.
If not already visible, open the ‘Create Data File’ form and select the data you wish to see in the reports. Please make sure that you choose under ‘Select Base Geography’ the corresponding geography to the digital map file you specified in the ‘Base File(s)’ property of the ‘Publish’ form. Also select the correct split which will divide the data into the different reports. If you do not have a split representing the reports you wish to publish, you will need to set it up first. Please refer to section ‘Setting up Splits’.
Choose an output folder and click ‘Create File(s)’. Data files will be created in this folder.
Multiple instances of the Batch Publisher will open and close automatically as publishing progresses. ZIP Archives (.zip) containing published reports will be saved in the folder specified for the ‘Zip Folder’ setting. The dynamic reports will be unpacked to the folder specified for the ‘Destination Folder’ setting. Depending on the number of reports you are publishing and the number of geographic features in each report this process may take minutes or hours.
In this example five ZIP archives would be created in a folder called ‘reports’ on the computer’s C: drive. These would be unpacked to the same folder, automatically creating five subfolders with the names corresponding to your split values (the parts of Edinburgh in this example). Each subfolder would contain a dynamic report displaying post code sectors for a part of Edinburgh.
Please note: If you have published a set of reports using one of the 6.10.0 (or later) templates, the data within each individual report will initially be dummy data generated by the batch publisher. To replace this with the data from your Excel workbook, you will have to re-export the data files with the setting ‘Update Files Only’ set to ‘Yes’ in the Publisher worksheet.
Creating Multiple Geography Reports
It is possible to use the Batch Publisher to create reports with multiple base geographies. Please read section ‘Multiple Geography Reports’ in the InstantAtlas Desktop User Guide first to understand how to create such reports with the Desktop Publisher before reading further.
Imagine you wish to create reports with Edinburgh post code districts as your first base geography layer, the centroids of the Edinburgh post code sectors as your second base geography layer and a final base geography layer of the boundaries of the Edinburgh post code sectors. Then you wish to create one report for each of the five different parts of Edinburgh: Centre, North, South, East and West.
You can store the data for all geography types in the same Access Database. If you wish to keep them in different Access files, you can do this as well. Set up a split for each of the geography types with the same split values.
For the example with the Edinburgh post code data you will need to populate the database with the data for the post code districts, the data for the centroids of the post code sectors and the data of the post code sector boundaries. Set up three separate splits and assign to each of the geography features one of the values ‘Edinburgh Centre’, ‘Edinburgh North’, ‘Edinburgh South’, ‘Edinburgh East’ and ‘Edinburgh West’.
The next step is to create the data.xml files for each geography type separately using the ‘Create Data File’ form of the Access Data Manager with exception of the last base geography. Make sure you select the respective split for each of the geography types. Save the resulting split files into separate folders, one for each base layer. The naming of folders is irrelevant.
![]() Please note, the file format of the data files must be XML, not JSON. This is because the batch publisher can only read data files in XML format, however it converts them to JSON during the publishing process when using an HTML template.
Please note, the file format of the data files must be XML, not JSON. This is because the batch publisher can only read data files in XML format, however it converts them to JSON during the publishing process when using an HTML template.
![]() If you simply wish to update the data of an existing set of batch reports (set ‘Update Files Only’ to ‘Yes’), you will need to provide the data files in JSON format.
If you simply wish to update the data of an existing set of batch reports (set ‘Update Files Only’ to ‘Yes’), you will need to provide the data files in JSON format.
In the example with the Edinburgh post code data you should create the data files for the first two layers (post code districts and post code sector centroids) into two separate folders. During the export the Access Data Manager creates five split data files for each geography type.
Before creating the data files for the last base geography layer, open the ‘Publish’ form. Enter under ‘Base File(s)’ a semi-colon delimited list of all base geography layers together with their code field, name field and alias. The order needs to be the same as the order you wish to see them in the report.
In the ‘Data File Folders for Additional Base Layers’ property enter a semicolon delimited list of absolute paths to the folders containing the data split files of all base layers besides the last one. The order needs to be the same as for the ‘Base Files’.
In the example with the Edinburgh post code data the entries for the ‘Base File(s)’ and ‘Data File Folders for Additional Base Layers’ would be:
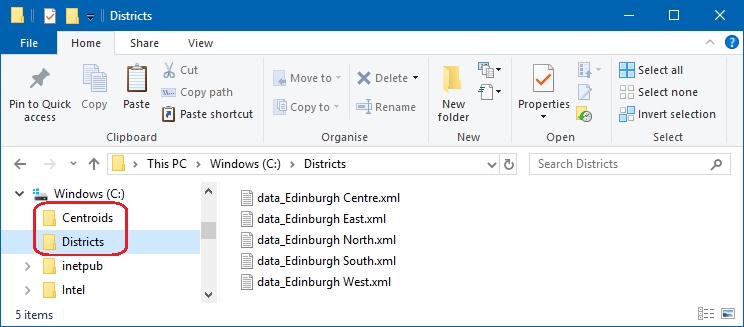
Base File(s): C:\Program Files\EsriUK\InstantAtlas\maps\post_code_districts.shp+PCD_CODE+PCD_NAME+Post Code Districts; C:\Program Files\EsriUK\InstantAtlas\maps\post_code_sectors_centroids.shp+PCS_CODE+PCS_NAME+Post Code Sectors Centroids; C:\Program Files\EsriUK\InstantAtlas\maps\post_code_sectors.shp+PCS_CODE+PCS_NAME+Post Code Sectors
Data File Folders for Additional Base Layers: C:\Districts;C:\Centroids
If required, you can define layer specific settings in the ‘Editable Settings’ property for multiple base layers by providing a semi-colon delimited list of values.
Please note that for editable settings that apply to both base and contextual layers, e.g. ‘layerBorderThickness’, the values are assigned first in the order of the base layers and then to the contextual layers in their order. For the example with the Edinburgh post code data a setting of ‘layerBorderThickness=1;2;1;3;2’ would result in the following:
Post Code Districts border width of 1px
Post Code Sector Centroids border width of 2px
Post Code Sectors border width of 1px
First contextual layer border width of 3px
Second contextual layer border width of 2px
Once all settings are defined you can go back to the ‘Create Data File’ form, select the data for the last base layer and click the ‘Create File(s)’ button to start the batch publishing process.