
Introduction
The objective of this guide is to help InstantAtlas Desktop users set up area-specific geographic drill downs.
For example, a top level dynamic report might display a thematic map for districts in Nottinghamshire.
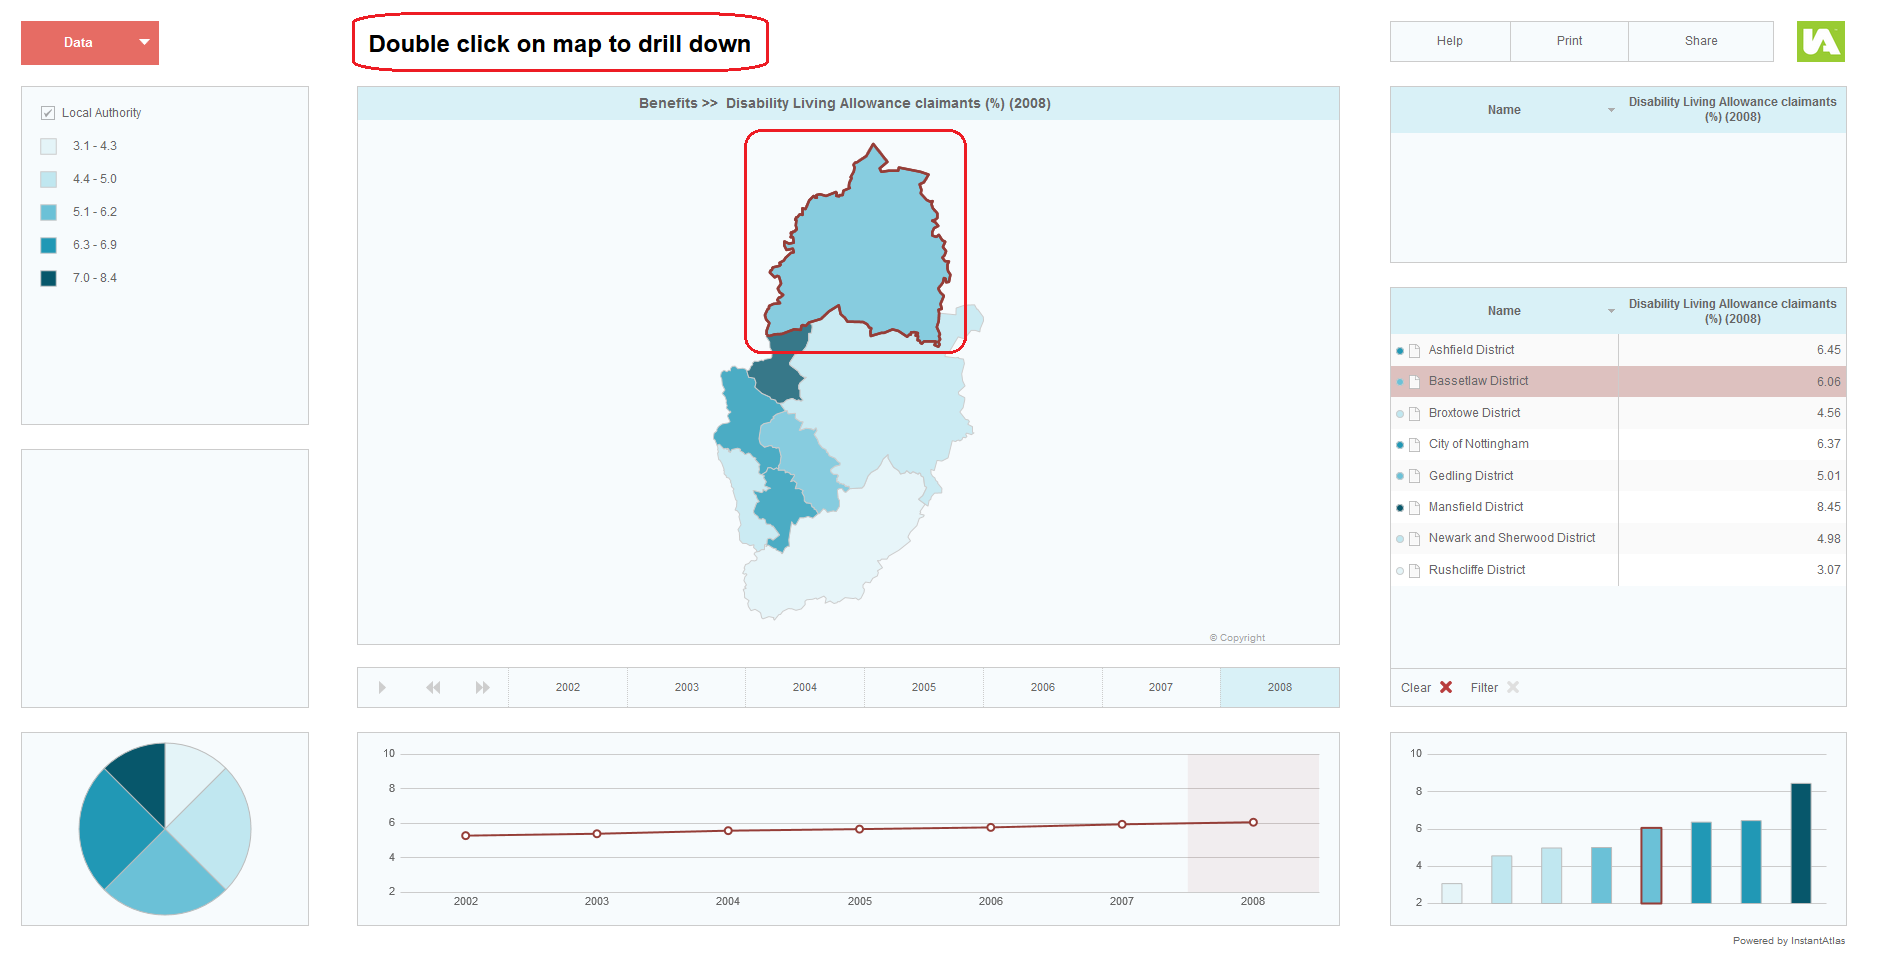
When an area is double clicked in the top level dynamic report, a new dynamic report opens displaying a thematic map for more detailed areas (e.g. wards) within the selected district. This example is illustrated in the image below for the Bassetlaw District (highlighted in the image above).

This user guide will explain how to setup drill-downs within InstantAtlas. This functionality can be implemented in all templates. It is a known software issue that the second map of the Double Map and the Double Map Time Series template will not react when double-clicked.
To enable this function, a custom script will need to be copied from this guide and pasted into the custom.js file of your top level dynamic report (i.e. the dynamic report you wish to link from).
Folders and Dynamic Reports
For a drill down to work correctly it is important that you organise and name your folders correctly. The easiest way is to place the dynamic reports you are drilling down to in subfolders within the folder that contains the top level dynamic report. These subfolders require a specific name so that they can be linked to correctly when the drill-down function is triggered. The name of each subfolder must be the same as the code of the geographic feature in the top level dynamic report that is used to drill down to that dynamic report. The codes of geographic features in the top level dynamic report are listed in the geographies.csv file created when the top level dynamic report was published.
The image below shows the contents of the folder containing the top level HTML dynamic report:
![]()
Most of the files belong to the top level dynamic report but you can see eight subfolders that contain dynamic reports that will be drilled down to. They have been given folder names that match the codes of the geographic features in the top level dynamic report used to drill down to them. In this example, the Nottinghamshire local authority dynamic report contains 8 districts with codes of ’00FY’, ’37UB’, ’37UC’, ’37UD’, ’37UE’, ’37UF’, ’37UG’ and ’37UJ’ and this is reflected in the naming of subfolders.
The Drill Down Script
Now that your dynamic report folders have been correctly organised and named, you can paste the drill down custom script into the custom.js file of the top level dynamic report.
Please do the following:
1. Navigate to the folder that contains your top level dynamic report and open the custom.js file using a text editor (e.g. Notepad).
2. Copy and paste the following code between the curly brackets of the iaOnReportComplete = function(report) function (Line 34):
// The dataGroup object exposes functions and properties of the data.
var dataGroup = report.getComponent("dataGroup");

mapDrillDown = function()
{
    var baseLayers = dataGroup.mapData.baseLayers;
    for (var i = 0; i < baseLayers.length; i++)
    {
        var layer = baseLayers[i];
        layer.addEventListener(ia.ItemEvent.ITEM_CLICK, itemEventHandler);
    }

    var clicks = 0

    function itemEventHandler(event)
    {
        if (event.type == ia.ItemEvent.ITEM_CLICK)
        {
            // Test for double click.
            clicks++;
            if (clicks == 1)
            {
                setTimeout(function()
                {
                    if (clicks == 1)
                    {
                        ia.log("single click");

                        // Open a new page using the id of the clicked item.
                        // Replace "_self" with "_blank" to open in a new tab.
                        var w = window.open('./' + encodeURIComponent(event.item.id) + '/atlas.html', "_self"); w.focus();
                    }
                    else
                    {
                        ia.log("double click");
                    }
                clicks = 0;
                }, 300);
            }
        }
    };
};
mapDrillDown();
The custom script defined above will enable the drill down dynamic report to be loaded on a single click. If you prefer it to work on a double click, use the code below instead:
// The dataGroup object exposes functions and properties of the data.
var dataGroup = report.getComponent("dataGroup");

mapDrillDown = function()
{
    var baseLayers = dataGroup.mapData.baseLayers;
    for (var i = 0; i < baseLayers.length; i++)
    {
        var layer = baseLayers[i];
        layer.addEventListener(ia.ItemEvent.ITEM_CLICK, itemEventHandler);
    }

    var clicks = 0

    function itemEventHandler(event)
    {
        if (event.type == ia.ItemEvent.ITEM_CLICK)
        {
            // Test for double click.
            clicks++;
            if (clicks == 1)
            {
                setTimeout(function()
                {
                    if (clicks == 1)
                    {
                        ia.log("single click");


                    }
                    else
                    {
                        ia.log("double click");
                        // Open a new page using the id of the clicked item.
			// Replace "_self" with "_blank" to open in a new tab.
                        var w = window.open('./' + encodeURIComponent(event.item.id) + '/atlas.html', "_self"); w.focus();
                    }
                clicks = 0;
                }, 300);
            }
        }
    };
};
mapDrillDown();