
The aim of this guide is to describe how to define indicator-specific chart axis labels in InstantAtlas HTML dynamic reports. It is advised that you read the Designer and Excel Data Manager sections of the InstantAtlas Desktop User Guide prior to reading this guide.
It is possible to display the name of the selected geography, theme, indicator and date in chart axis labels by adding substitution variables into the configuration file ‘X Axis Label’ and ‘Y Axis Label’ properties . The variables to be used are:
${geogName}
${themeName}
${indicatorName}
${date}
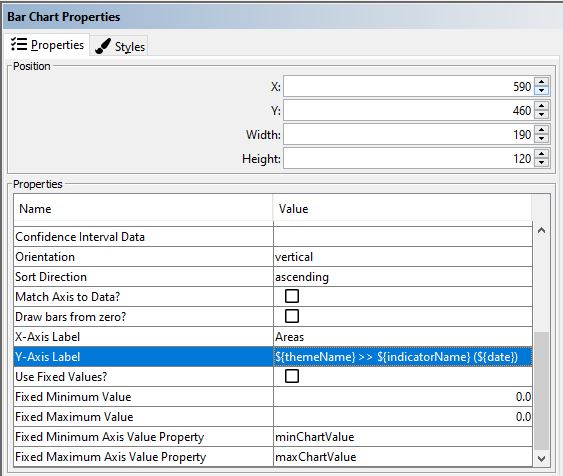
You can combine these variables with static text as in the image below.
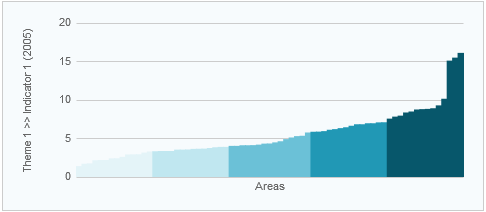
The resulting bar chart would look similar to this:
If you wish to display indicator specific text in the chart axis labels that does not correspond to either your geography, theme, indicator and date names, you can define these labels using metadata properties for the indicators. You will have to enter something like this into your ‘Metadata’ worksheet:
| ElementType | Element | MetadataElement | Value |
| Indicator | Indicator 1 | x_axis_label | x axis label for Ind 1 |
| Indicator | Indicator 1 | y_axis_label | y axis label for Ind 1 |
| Indicator | Indicator 2 | x_axis_label | x axis label for Ind 2 |
| Indicator | Indicator 2 | y_axis_label | y axis label for Ind 2 |
In the ‘Element’ column you will need to enter your indicator names. For the ‘MetadataElement’ you can choose any variable names (apart from those reserved variables that are already used for other purposes). The ‘Value’ column contains the text that you wish to see as the axis label for this indicator.
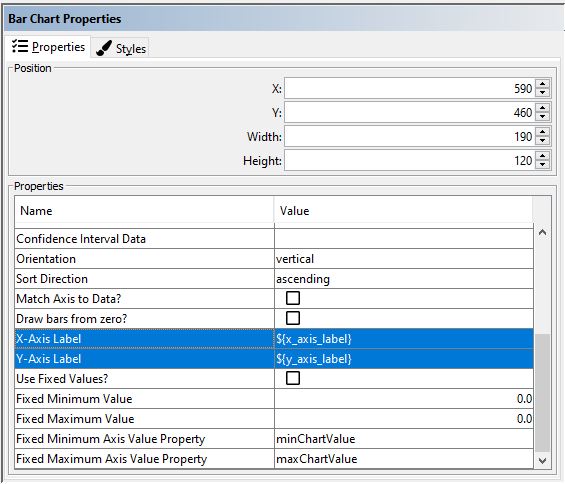
In the Designer you can now assign these variables to the axis labels:
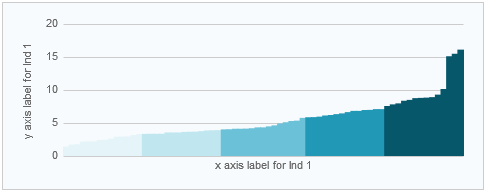
The resulting bar chart would look similar to this:
![]() As the labels do not clear when the user selects an indicator for which the variables have not been defined, you will have to define the variables for all of your indicators. You can define these variables on Theme, Indicator or IndicatorDate basis.
As the labels do not clear when the user selects an indicator for which the variables have not been defined, you will have to define the variables for all of your indicators. You can define these variables on Theme, Indicator or IndicatorDate basis.