Adding a map to your reports can provide some much needed context for your readers, and also display your data in an informative and engaging style. While a lot of the Report Builder widgets will likely be intuitive for the avid ArcGIS Online user, there are some widgets you may not be familiar with.
The map widget allows you to display a map of the report base layer either as a simple map of the areas available to report on, or as a thematic map, focused on a particular indicator. Alternatively, this widget also allows you to display any other web map you have available within ArcGIS Online.
Within this blog, I will walk you through an example use case of the Web Map widget, to help you get started with your own report. I will be using the new 2021 Census Population Summary data, filtered down by region. Continue reading Working with the Map Widget in Report Builder
In version 2.4.0 of Report Builder we have continued to improve the behaviour of the chart widgets, following an upgrade of the charting library in the 2.3.0 update. We have also made changes to how Report Builder works with ArcGIS Enterprise as the data, storage and authentication platform instead of ArcGIS Online.
New features
Ability to add fixed lines and zones to bar and line charts
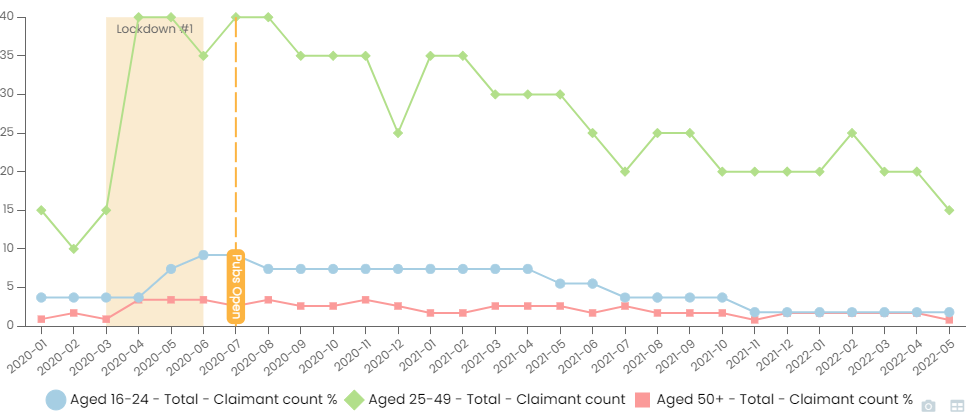
Bar and Line charts can now show fixed lines or zones additionally to the displayed indicator(s). You can add up to 4 lines and up to 4 zones to the chart. Each line has it’s own fixed value, label, colour, width and style. For each zone, the start and end value, label, colour and opacity can be defined. Lines and zones can be added to either the x or the y axis allowing for a wide rage of use cases.
Ability to add Mean and/or Median lines to bar charts
You can chose to display the mean and/or median line either superimposed over or behind the bars of your bar chart. The label, line style and colour can be adjusted.
Export/print options for web map widgets
The simple version of exporting a web map widget is by enabling the Export Snapshot Button which will appear at the bottom right of the map. It takes a simple screenshot of the map widget and saves it to your browser’s downloads folder.
The more advanced Print Button allows the user to print the web map into different file formats, providing a range of options for size and layout.
Both these export options are mutually exclusive, meaning the Export Snapshot Button will only show if the Print Button setting is toggled off. Please note that the Print Button is not available for 3D maps.
Improved support for using data in ArcGIS Enterprise
Report Builder already supported the use of ArcGIS Server services where these services have been referenced in ArcGIS Online to make them easier to access and discover. In this update however, we have taken further steps to make it possible to use ArcGIS Enterprise as the data, storage and authentication platform instead of ArcGIS Online.
If you are hosting your own data catalog, and this is the data source for a report, the catalog table (master table) can include URLs to services from ArcGIS Enterprise and Report Builder will request and handle the authentication to these services appropriately. If the items are (semi)private you will be prompted to sign in to see the data in the report, whether you are editing the report or viewing it as an end user. An example of this is shown below.
Failure to sign in as a user with sufficient privileges will mean that any widgets in the report containing private data will not load.
Currently, the data catalog master table itself must be hosted in ArcGIS Online, but this is a step towards alternative deployments where the data catalog as well as the data services are hosted in ArcGIS Enterprise.
If you are interested in using Report Builder with data hosted in ArcGIS Enterprise we would like to know, so please get in touch with your Esri UK account manager.
Series Type of Pie Charts simplified
The setting Series Type for Pie Charts has been removed as it caused confusion. The rules now are:
include all areas = true => one “pie” per indicator and each segment corresponds to a feature
include all areas = false => one “pie” per feature (i.e. if you use show comparisons = true) and each segment corresponds to an indicator
Further enhancements
You can now use the Configure App button within ArcGIS Online to open the edit version of the report.
There is now an option to open the metadata pop-up when selecting indicators for text widgets.
It is now possible to configure if comparison bars are displayed at the right of all other bars or included in the core feature bar sorting.
Key bug fixes
Bar charts showing counts per value for a lower level comparison geography (for example the deprivation charts in our standard National Data Service reports) no longer show the x-axis labels in random order.
Bar charts showing one indicator for all areas can again display comparison values as horizontal lines.
It is again possible to create a pie chart showing only one percentage indicator value and filling the remaining pie to 100%.
Metadata pop-ups in the data selection dialogs as well as in the table now hide empty fields.
Time Series Table: Metadata icons are no longer hidden when group-rows-by-indicator is active.
Charts are no longer cut off at the bottom if Title Position is set to title-bar.
Width and Height settings of widgets are now rounded to full numbers when resizing the widget by dragging the handlers.
All infographic widgets now have setting to enable and disable comparison features.
Indicator search option within the widget’s Data & Settings dialog is working reliably even for indicators with special characters or multiple whitespaces in the indicator name.
We hope you will enjoy this new release of Report Builder!
The main goal of Report Builder version 2.3.0 is the upgrade to the charting library (used for the chart widgets) to the latest available version. This is largely a behind-the-scenes change, although you may notice some very subtle differences to the look and feel of the charts. Besides improving performance and adding functionality, this enabled a number of chart-related feature requests and bug fixes. Version 2.3.0 also includes several non-chart related improvements and bug fixes, as well as changes to support new behaviour in the latest update to ArcGIS Online.
New features
Ability to remove chart axis lines without removing axis labels
We have introduced two advanced settings to cartesian charts called X Axis – Show Border? and Y Axis – Show Border? which allows for a chart like this (no Y-axis line):
Ability to show comparison bars in bar charts on the far right
Values for comparison areas are now always displayed to the right of any bar for core layer feature(s) and are not included in the sorting of the other bars.
Ability to insert the value for the current date and the current date
You can now use the #TODAY variable in a Text or Text Box widget to display indicator values for the current year. This is useful for indicators where the latest date might be different from the current date e.g. population projections.
The #TODAY variable picks up todays’ date and returns it using the specified format:
A tooltip has been added to the export icons of charts and tables.
Ability to add line breaks to tooltips
You can use \n to add a line break into a chart tooltip. This is especially useful for smaller chart widgets where the tooltip would otherwise be cut off.
Disable widget double-click edit
By default, double-clicking on a widget in a report will open the Data & Settings dialog, or in the case of a Text or Text Box Widget, the text editor. While double-clicking on a Text or Text Box Widget, it is possible to accidentally click the Cut button in the widget toolbar and remove the widget from the report, particularly if the text widget only contains one line of text. If you are finding this a problem, you can disable the double-click action for widgets. You can do this by clicking the ellipsis in the top right corner of Report Builder and toggling the Double-click to Edit setting.
Changes in Pie Chart legend layout
The update to the latest charting library meant that we had to make minor changes to the layout and position of Pie Chart legends. If you are using Pie Charts in your reports, especially if these are smaller widgets, you should check that all legend categories are still visible. If not, please adjust the size of the widget slightly until the full legend is displayed.
Key bug fixes
Chart widgets
Cartesian charts: axis colour is overwritten by grid line colour
Bar charts: bars sit on top of X-axis, causing axis line to only be visible between the bars
Pyramid Chart: palette colour is only applied to left side of chart
Report Builder crashes if you set a pyramid chart to Constrain Palette Colours = True and have only one colour defined in the Palette
Population pyramid with aggregated data – data label left/right settings get overridden
Scatterplot widget: default point size is too small
Text / Text Box Widgets
When highlighting the default text to delete it, the text editor closes if the mouse pointer is moved outside of text box
Inserting an icon doesn’t allow the icon to be selected (to delete it or change size or colour) and doesn’t allow for text to be added after the icon
Text not showing in Edit Text/Rules popup (the first time you edit it)
Other bug fixes
Report Builder doesn’t support nested/grouped layers in web maps built with the new ArcGIS Online map viewer
First page is blank if you print a report using Firefox
Groups on Report Builder home page are not displayed in alphabetical order
Time Series Table: table breaks if the indicators have different dates available
Long delay for a table widget to show when added to a report
“Save As” on existing report creates an AGOL item with an incorrect URL
Page order dialog crashes when report contains a large number of web map widgets
We hope you will enjoy this new release of Report Builder!
Commas missing between list of area names (#FNAMES) for aggregated reports
Importing/linking to other reports
It is now possible, for any page in a report, to specify another Report Builder report to import or to link to. This means that one report can be built from others, and that if linking is used, that any changes made to linked reports will automatically feed through to the parent report. This opens the door for a different approach to building and managing reports.
Note that this is beta functionality and we welcome any feedback on how we have implemented this in Report Builder. We created a help page and will be adding further information and examples to this.
To access the option to import or link, edit your report and click Pages > Current Page > Import or Link.
You will be asked for browse in your ArcGIS Online organisation for a report design to import/link.
We hope you will enjoy using this new functionality!
Report Builder version 2.1.0 introduces a new widget, the Toggle Content widget. This has been added in order to enable content sections in a report to be expanded/collapsed by the end user. Prior to the addition of this widget, the same “accordion” effect had to be achieved using styling in the website that the report was embedded into.
Toggle Content Widget
In the example below, the end user can click the button next to the Safeguarding heading to collapse the content below it (this is just an image, the toggle won’t do anything here!).
The different settings available for this widget are described on the widget help page.
Number Formatting
It is now possible to specify a percentage number format (P) for your widget to show data as percentages. For example, for a Data Table widget, locate the Number Format setting under Numbers & Values and replace this with P. For a Bar Chart widget, locate the Axis Label Format setting under Axes and type in P. Visit this page for more on the number formats supported in Report Builder.
Report Builder version 2.0.2 addresses a number of bugs, several of which will ensure a smoother migration from version 1 to version 2 reports. We have also added some of the functionality of Report Builder 1 that had not yet been implemented in version 2, as well as performance, accessibility and error handling improvements.
Bug fixes
Bar Charts set to horizontal orientation now also work when the selected data contains upper and lower confidence limits.
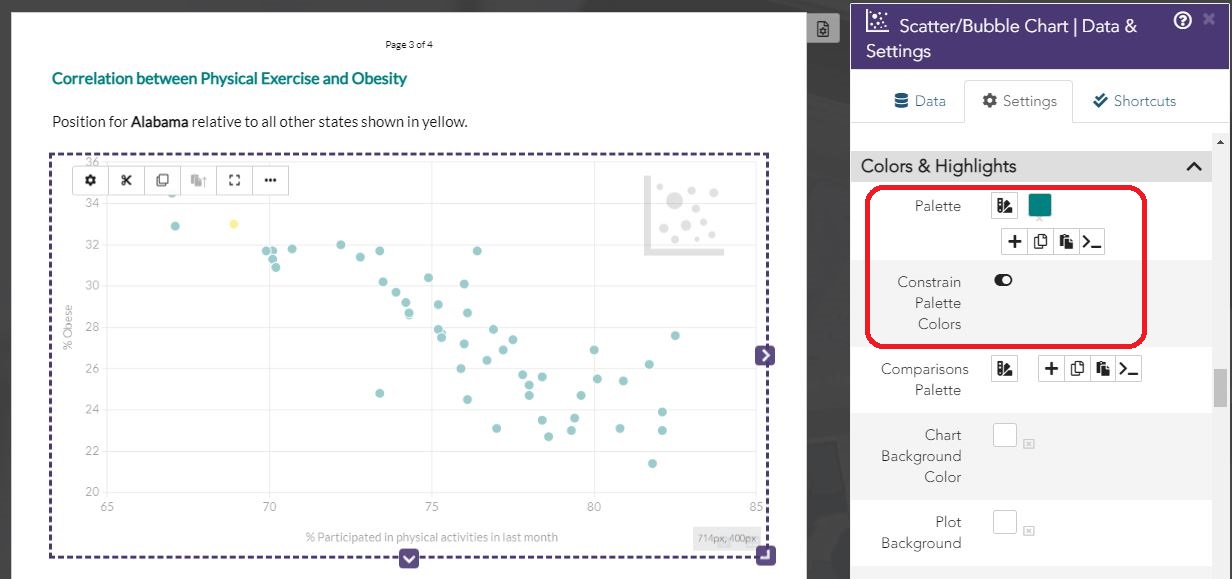
The Scatter/Bubble Chart widget has gained the setting X Axis Range which allows the x-axis to be constrained between two defined values.
The Scatter/Bubble Chart widget can now be configured to show all points in the same colour without having to define a separate colour for each feature. This is done by switching Constrain Palette Colors on:
The Filled Icon widget now shows the icon filled in the selected Highlight Color if Highlight Selected Feature is enabled.
Copying widgets from one report to another now works more reliably. In version 2.0.1 and when copying multiple widgets in succession, a browser refresh was required between pasting different widgets.
In the Edit Chart Colors… dialog (main menu – Styling – Chart Colors) the Toggle direct edit buttons now work by providing a text field to insert colour values in hexadecimal or RBG format.
Exiting a report now takes the user back to the same folder view with the same sorting retained.
Fix for an issue with hash/anchor links that occurred when using the # symbol in the browser address bar . This allows users e.g. to jump to a particular section of a report by providing the URL to the anchor tag.
Fix for certain font families (those containing spaces in the name) not being applied in view mode of a report.
Improved migration
Pie Charts in migrated reports no longer group small segments together into one category.
Titles of Table widgets are now migrated correctly.
The content of the Table Footer settings from Report Builder 1 is now migrated to the setting Caption in Report Builder 2. Please note: Any tables in reports that have been migrated and saved before the release of Report Builder version 2.0.2 will have lost the Table Footer text. You can re-add the text by entering it into the Caption setting manually. Alternatively, if the equivalent version 1 report still exists, you can migrate it again.
Additional functionality
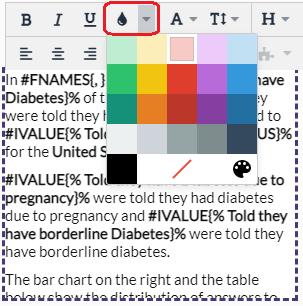
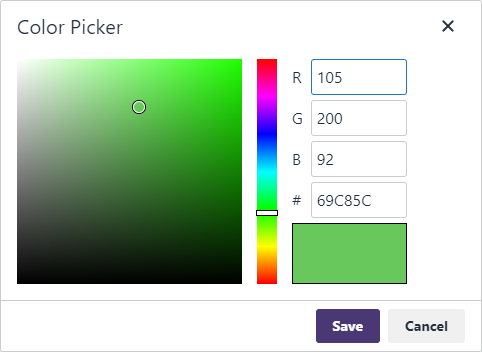
It is now possible to change the font colour of text in a Text widget through the editor toolbar. You have the option to choose one of the predefined colours or use the palette icon to open the Color Picker dialog
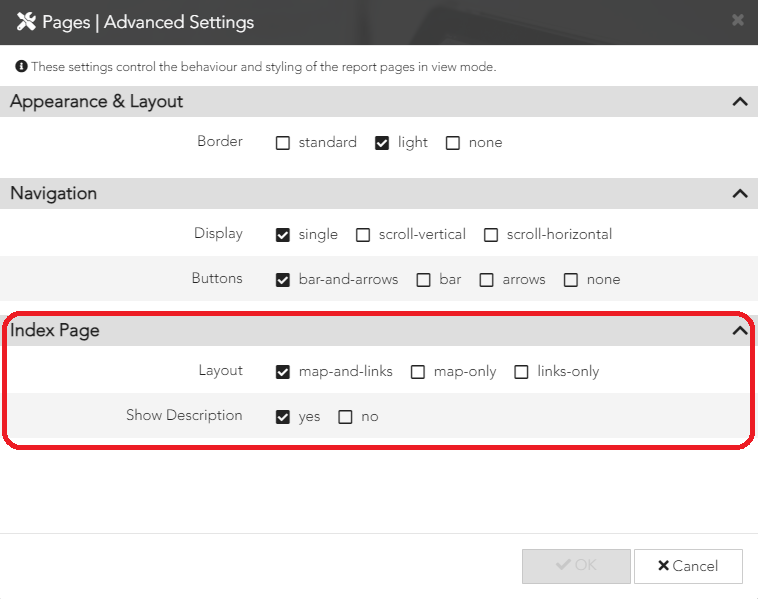
The Advanced Settings dialog in the Pages menu has gained options to customise the index page of the report.
Any changes to the Pages|Advanced Settings dialog now turns the Save button of the report editor orange, indicating that there are unsaved changes.
Line and scatterplot widget point styles have been extended and some of the less obvious options have been subtly renamed.
Web accessibility has been improved by adding the option to show unique point markers in chart series lines and index options to chart labels – please see this blog post to find out more about accessibility for reports created using Report Builder.
The Data Catalog data model is cached in the browser whilst the editor page is open, which means the widget settings dialog opens faster.
Widgets have become more robust to temporary data connection errors. If a connection fails, the widget will attempt to reconnect to the data after a few seconds, up to 3 times before giving up.
If you have any questions relating to this release or migration of reports from version 1 to version 2 please contact support@instantatlas.com.
A major new version of InstantAtlas Report Builder (version 2.0) is now available. Report Builder 2.0 is a complete redesign and rebuild of the application, keeping all that was good from version 1 whilst making the reports faster to load, easier to create, more responsive to different devices and more accessible to a range of users.
The process of building a report and editing widgets is essentially the same as in Report Builder 1. It was important to us that that existing users did not have to learn how to create reports all over again! However, there are a few notable differences within the Editor user interface that we thought we would point out to make switching to using Report Builder 2 a little easier.
Saved report location
When you create a new report in 2.0, this will automatically be saved either in the root of your ArcGIS Online account, or if you selected a folder on the Report Builder homepage before creating your report, in that folder. You can always move this to a different folder if you need to using the ‘Move’ option in ArcGIS Online.
Context menu
We no longer override the browser’s context menu when right-click with your mouse on a report page in the Report Builder workspace. You can access the same functionality in other ways, either from the top menus, or in the case of pasting a widget, using the ‘jigsaw bar’ at the foot of the page or by selecting an existing widget on the page and clicking the page button that appears in the widget toolbar.
Setting Comparison Areas for a widget
This is now done from the Settings tab of the widget Data & Settings window – in Report Builder 1 it was done under the Data tab.
Setting a widget to show data for all areas
This is now done from the Settings tab of the widget Data & Settings window (usually in the Behaviour settings group which becomes visible when the advanced settings are toggled on) – in Report Builder 1 it was done under the Data tab.
Publishing reports as a bundle of static files
This was an option in Report Builder 1 option but has been dropped. It is unnecessary due to the way the reports load in Report Builder 2. It is entirely possible to use reports ‘live’ so that they always show the latest data in the report data source(s), and so that you do not have to publish them as static files each time the source data is updated.
Report navigation toolbar
By default, reports now show a toolbar at the top. This allows the user to switch page, print and return to the report index page with the list of features to select from. This toolbar can be hidden if necessary by clicking the Pages menu > Advanced.
A major new version of InstantAtlas Report Builder (version 2.0) is now available. Report Builder 2.0 is a complete redesign and rebuild of the application, keeping all that was good from version 1 whilst making the reports faster to load, easier to create, more responsive to different devices and more accessible to a range of users. Continue reading IA Report Builder 2.0 – 22 April 2021 Release Notes