IA Data Explorer 2.1.0 – 10 May 2022 Release Notes

List of changes

Ordering of indicators

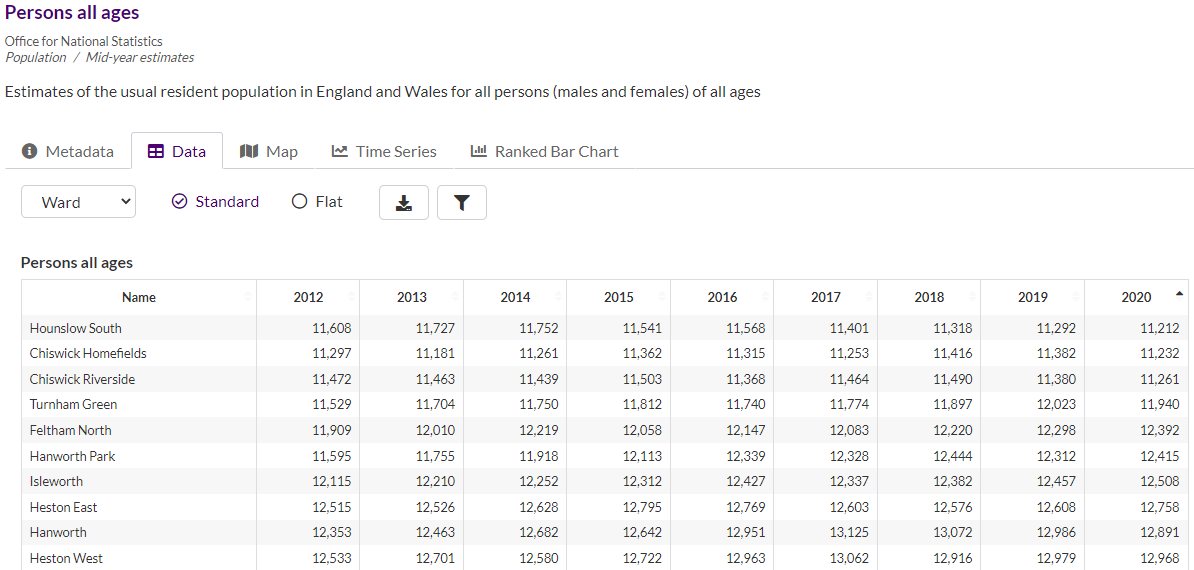
We have improved the order in which the Data Explorer will display indicators from the National Data Service on initial load and when it is filtered to a theme (with no search term). Prior to this change, indicators in different themes were ending up with an identical score for the purposes of ordering, which resulted in an illogical and confusing list of indicators from different sub-themes. Where an indicator has supporting indicators (e.g. numerator, denominator, confidence intervals), such as much of the health data in the National Data Service, the supporting indicators are now consistently listed immediately below the main indicator to make it easier to read the list. On initial load, the ONS mid-year population estimates appear first, with the total population at the top of the list.

Table sorting

It is now possible to sort the columns ascending/descending in the table view by clicking on a column heading. The sorting state is maintained even if you switch to view data for a different geography.

Mixed data sources

We have made improvements to the way the Data Explorer works with a data catalog that references ArcGIS Enterprise services as well as services in ArcGIS Online, whether these are public or restricted. This is important for customers that host their own data catalog and wish to incorporate data from a mix of sources.

Custom metadata fields

Again, for customers hosting their own data catalog, any custom/extra fields added to the data catalog metadata table will now be displayed in the Data Explorer (in the Metadata view).

Hiding indicators

There is now a configuration option to hide indicators that do not have an entry in the data catalog metadata table. This can be useful to exclude certain indicators that need to be part of the catalog, but do not need to be listed in the Data Explorer.

Bug fixes

  • Unable to backtrack after insufficient rights to view a restricted indicator
  • ArcGIS Online token included in Share link when viewing a restricted indicator

We hope you will enjoy the new version of Data Explorer!

If you have any questions relating to this release please contact support@instantatlas.com.

IA Report Builder 2.2.0 – 15 October 2021 Release Notes

Overview

Report Builder version 2.2.0 fixes a number of bugs and also introduces functionality (beta) to import or link to other reports.

Bug fixes

  • Case sensitivity issue with feature ID field
  • Stacked bar chart with look-down comparison areas shhowing incorrect colours
  • Web map widget – visible layers not acting on raster layers
  • Text widget stripping text following a number (improvement to number formatting)
  • Editing table widget indicator aliases breaks widget height
  • Icon Chart widget height behaviour
  • “Fill to” settings missing from Icon Chart widget
  • Toggler widget not working on a phone screen
  • Report toolbar display issues on a phone screen
  • Commas missing between list of area names (#FNAMES) for aggregated reports

Importing/linking to other reports

It is now possible, for any page in a report, to specify another Report Builder report to import or to link to. This means that one report can be built from others, and that if linking is used, that any changes made to linked reports will automatically feed through to the parent report. This opens the door for a different approach to building and managing reports.

Note that this is beta functionality and we welcome any feedback on how we have implemented this in Report Builder. We created a help page and will be adding further information and examples to this.

To access the option to import or link, edit your report and click Pages > Current Page > Import or Link.

Report Builder option to import or link a report

You will be asked for browse in your ArcGIS Online organisation for a report design to import/link.

Report Builder choose report design option

We hope you will enjoy using this new functionality!

If you have any questions relating to this release please contact support@instantatlas.com.

IA Report Builder 2.1.0 – 19 July 2021 Release Notes

Overview

Report Builder version 2.1.0 introduces a new widget, the Toggle Content widget. This has been added in order to enable content sections in a report to be expanded/collapsed by the end user. Prior to the addition of this widget, the same “accordion” effect had to be achieved using styling in the website that the report was embedded into.

Toggle Content Widget

In the example below, the end user can click the button next to the Safeguarding heading to collapse the content below it (this is just an image, the toggle won’t do anything here!).

InstantAtlas Report Builder Toggle Content Widget

The different settings available for this widget are described on the widget help page.

Number Formatting

It is now possible to specify a percentage number format (P) for your widget to show data as percentages. For example, for a Data Table widget, locate the Number Format setting under Numbers & Values and replace this with P. For a Bar Chart widget, locate the Axis Label Format setting under Axes and type in P. Visit this page for more on the number formats supported in Report Builder.

If you have any questions relating to this release please contact support@instantatlas.com.

Tips for using Report Builder 2.0

A major new version of InstantAtlas Report Builder (version 2.0) is now available. Report Builder 2.0 is a complete redesign and rebuild of the application, keeping all that was good from version 1 whilst making the reports faster to load, easier to create, more responsive to different devices and more accessible to a range of users.

The process of building a report and editing widgets is essentially the same as in Report Builder 1. It was important to us that that existing users did not have to learn how to create reports all over again! However, there are a few notable differences within the Editor user interface that we thought we would point out  to make switching to using Report Builder 2 a little easier.

Saved report location

When you create a new report in 2.0, this will automatically be saved either in the root of your ArcGIS Online account, or if you selected a folder on the Report Builder homepage before creating your report, in that folder. You can always move this to a different folder if you need to using the ‘Move’ option in ArcGIS Online.

Context menu

We no longer override the browser’s context menu when right-click with your mouse on a report page in the Report Builder workspace. You can access the same functionality in other ways, either from the top menus, or in the case of pasting a widget, using the ‘jigsaw bar’ at the foot of the page or by selecting an existing widget on the page and clicking the page button that appears in the widget toolbar.

Setting Comparison Areas for a widget

This is now done from the Settings tab of the widget Data & Settings window – in Report Builder 1 it was done under the Data tab.

Setting a widget to show data for all areas

This is now done from the Settings tab of the widget Data & Settings window (usually in the Behaviour settings group which becomes visible when the advanced settings are toggled on) – in Report Builder 1 it was done under the Data tab.

Publishing reports as a bundle of static files

This was an option in Report Builder 1 option but has been dropped. It is unnecessary due to the way the reports load in Report Builder 2. It is entirely possible to use reports ‘live’ so that they always show the latest data in the report data source(s), and so that you do not have to publish them as static files each time the source data is updated.

Report navigation toolbar

By default, reports now show a toolbar at the top. This allows the user to switch page, print and return to the report index page with the list of features to select from. This toolbar can be hidden if necessary by clicking the Pages menu > Advanced.

InstantAtlas integration with Power BI

This article describes how to use data from the InstantAtlas National Data Service in Microsoft Power BI. The National Data Service is delivered as ArcGIS Online feature layers.

The steps for using data in ArcGIS in Power BI are described here. It is possible to use the steps in the Appendix to bring data from the National Data Service into Power BI.

However, when using data from the National Data Service specifically, a better result can be achieved using a custom query in the Power BI Advanced Editor. The steps for doing this are described below.

Sign in to the Data Catalog Hub and use the Data Explorer app to search for the indicator you are interested in. Click on any of the tabs and click the button to view the item in ArcGIS Online.

IA data explorer link to ArcGIS button

In ArcGIS Online, on the item overview page, click the layer corresponding to the geography you want to display data for in Power BI. Then click the Copy button on the right to copy the URL.

ArcGIS Online copy feature layer URL button

Amend this URL (e.g. in Notepad) to add this to the end:


query?where=1%3D1&outFields=*&returnGeometry=false&resultRecordCount=0&f=json

The URL should now look something like this:


https://services1.arcgis.com/HumUw0sDQHwJuboT/arcgis/rest/services/Suffolk_Pop_Est_Female/FeatureServer/0/query?where=1%3D1&outFields=*&returnGeometry=false&resultRecordCount=0&f=json

Open Power BI Desktop and click Get Data, Web. Paste your URL into the URL box and click OK.

Power BI URL box

You will get something like this:

Power BI data import

Click Transform Data. The Power Query Editor will open. Click Advanced Editor.

Power BI Advanced Editor

Replace the query in the Advanced Editor with the one below. Make sure you adjust the URL at the start of the query (shown in red) to the one you are actually using.


let
    Source = Table.FromColumns({Lines.FromBinary(Web.Contents("https://services1.arcgis.com/HumUw0sDQHwJuboT/arcgis/rest/services/Suffolk_Pop_Est_Female/FeatureServer/0/query?where=1%3D1&outFields=*&returnGeometry=false&resultRecordCount=0&f=json"), null, null, 65001)}),
    #"Parsed JSON" = Table.TransformColumns(Source,{},Json.Document),
    Column1 = #"Parsed JSON"{0}[Column1],
    fieldSet = Column1[fields],
    fieldNames = List.Transform(fieldSet, each Record.Field(_, "name")),
    fieldAliases = List.Transform(fieldSet, each Text.Combine({Text.Replace(Record.Field(_, "alias"), "|", " | "), " (", Record.Field(_, "name"),")"})),
    features = Column1[features],
    #"Converted to Table" = Table.FromList(features, Splitter.SplitByNothing(), null, null, ExtraValues.Error),
    #"Expanded Column1" = Table.ExpandRecordColumn(#"Converted to Table", "Column1", {"attributes"}, {"Column1.attributes"}),
    #"Expanded Column1.attributes" = Table.ExpandRecordColumn(#"Expanded Column1", "Column1.attributes", fieldNames, fieldAliases)
in
    #"Expanded Column1.attributes"

Power BI Advanced Editor new query

Click Done.

National Data Service data in Power BI

Note that the data type for the columns is text. You should change this for the data you wish to use. Select the columns in question, right-click, Change Type and choose the appropriate type.

Change data type in Power BI

Then click Close & Apply in the ribbon.

You can then create your visualisation with the data from the feature layer.

Power BI visualisation with National Data Service data

IA National Data Service – July 2020 Data Update

Crime

Crime data (May) updated 1 July. All affected reports updated by 6 July.

Children & Education

The following education data was updated in July and relative reports updated by the 29th of July:

      • 2018/19 Key stage 2
      • 2018/19 Key Stage 4
      • 2018/19 Key Stage 5
      • 2018/19 Special Educational Needs (SEN)
      • 2018/19 Free School Meals (FSM)
      • 2018/19 Pupils Characteristics

Economy & Employment

Claimant Count (June) updated during July.

April 2019 to March 2020 Annual Population Survey (APS) updated during July. Reports updated by the 22nd of July.

A detailed breakdown of statistics included within the APS is listed below:

      • Disability (Equality Act) core level by economic activity
      • Economic activity of those with health conditions or illnesses lasting more than 12 months
      • Economic activity rate
      • Economically inactive
      • Employment rate
      • Ethnic group by economic activity
      • Full-time and part-time employment
      • Hours worked weekly
      • Industry of employment (SIC 2007)
      • Nationality by white/ethnic minority
      • Occupation (SOC2010) major group of employment
      • Public and private sector employment
      • Qualifications (GCSE/NVQ)
      • Self-employed, employees and non-permanent employment
      • Unemployment rate
      • White/ethnic minority by age
      • Estimates of unemployment (model-based)

Deprivation

HMRC and DWP’s previous statistics relative to children in low income families have been replaced and deprecated to provide a more coherent picture of this category for both Relative and Absolute Low Income.

Latest data for Children in Low Income Families Data has been updated on the 21st of July, from financial year 2014/15 to 2018/19.


IA Data Catalog – 31 July 2020 Release Notes

The latest version of InstantAtlas Data Catalog (version 2.1.3) is now available at https://hub.instantatlas.com/.

Enhancements:

  • ArcGIS JavaScript API migrated to version 4.x
  • Web Map Builder uses smartMapping module(s) from API throughout
  • Web Map Builder now has a new option to allow proportional symbols for count data (user option). This option is available from the ellipsis menu in the top right corner
  • Inspector now shows warning messages when Item_Order is missing for an Indicator in the master table
  • Web Map Builder now handles categoric data gracefully
  • The Data Catalog Manager pre-checks for new core layers in hosted tables to ensure that updates stay in sync
  • The Data Catalog Manager disables buttons in the UI that trigger an update whilst another update is still processing
  • Minor UI cleanup around dialogs and buttons

Bug fixes:

  • Web Map Builder will now exclude data where all values are null from the map – previously this was causing an error dialog to appear
  • Web Map Builder how handles Feature Collections properly when opening an existing web map – previously this was generating a JSON error
  • Metadata page now falls back to using the standard metadata table if there is not one defined within the targeted master table

IA Data Explorer – 10 July 2020 Release Notes

The latest version of InstantAtlas Data Explorer (version 2.0.2) is now available at https://hub.instantatlas.com/.

Version 2.0.2 includes two areas of change.

View ArcGIS Online Item button

If you are signed in to ArcGIS Online (i.e. you sign in via the Data Catalog app or the Data Explorer app is launched with a ?token=xxxxxx argument) you will see a View ArcGIS Online Item button displayed under the Data, Map, Time Series or Ranked Bar Chart tabs.

IA data explorer link to item button

When clicked, the button takes you to the item in ArcGIS Online that contains the data for indicator you are viewing in the data explorer.

This button has been added in order to make it easy to obtain the endpoint of the ArcGIS feature layer containing an indicator from an InstantAtlas data catalog. There are a number of scenarios in which it might be useful to have the endpoint, one being that it enables the use of the data held in the data catalog in other third party systems, such as Microsoft Power BI for example.

Update to sharing/token behaviour

The Data Explorer has been updated so that when it is run in authorised mode (i.e. not shared with everyone) it will pass the token down to all of the feature services it uses. Furthermore, a public-shared Data Explorer will detect whether it needs a sign in for specific feature layers. If the data for the indicator searched for is stored in a feature layer that is protected, the user will be asked to sign in to ArcGIS Online in order to view the indicator in question.

How to embed InstantAtlas apps into your website

The purpose of this post is to provide the necessary information for embedding InstantAtlas apps into a website. Colour is used to explain the code below – if you have difficulty distinguishing the colours used please contact support@instantatlas.com and we will find an alternative. The actual creation of the apps in the first place is not covered in this post.

Data Explorer

InstantAtlas Data explorer apps connect directly to an InstantAtlas Data Catalog in ArcGIS Online and allow your web site users to browse and download data and create graphics for documents and presentations.

Add this code to a web page to embed a data explorer app.


<link href="https://hub.instantatlas.com/data-catalog-explorer/static/css/main.css" rel="stylesheet">
<div id="root"></div>
<script src="https://hub.instantatlas.com/data-catalog-explorer/static/js/main.js"></script>
<script>window.dataCatalogExplorer.launch({ "appid": "e3d83edc76bd45548ddd0e2ee4fe4bdf", "container": "root" })</script>‎

e3d83edc76bd45548ddd0e2ee4fe4bdf – this is the app ID (from ArcGIS Online) of the data explorer app you wish to embed.

An example of embedding a data explorer app can be seen on this page of the Suffolk Observatory.

Map Explorer

Map Explorer apps are simple-to-use apps that that allows a user to select from a pre-defined set of indicators from an InstantAtlas Data Catalog and visualize them as thematic maps.


<div id="ia-map-panel" style="width: 100%; min-height: 500px; height: calc(100vh - 300px);">
<script src="https://hub.instantatlas.com/map-explorer/embed?c=ia-map-panel&appid=917b1891e5934d6baeeff23cdb0e9f38"></script>
</div>

917b1891e5934d6baeeff23cdb0e9f38 – this is the app ID (from ArcGIS Online) of the map explorer app you wish to embed.

Custom Area Reporter

The Custom Area Reporter is an app that allows users to make a custom selection of areas to be viewed in an aggregated or disaggregated form in a report published using Report Builder for ArcGIS. Users select areas from a map using a range of selection tools. Once the areas have been selected, the user can choose from a list of reports – this list is defined in the app configuration.

Add this code to a web page to embed a custom area reporter app.


<link href="https://www.reports.esriuk.com/custom-area-reporter/static/css/car.css" rel="stylesheet">
<div id="car-container" style="width: 100%; height: 500px; border: 1px solid #ccc; position: relative;"></div>
<script src="https://www.reports.esriuk.com/custom-area-reporter/static/js/car.js"></script>
<script defer="defer">window.customAreaReporter.launch({ appid: '1a451d1bbe3544849585ab2745c25f5d', container: 'car-container' });</script>

1a451d1bbe3544849585ab2745c25f5d – this is the app ID (from ArcGIS Online) of the custom area reporter app you wish to embed. The code above contains some styling of the container for the app that you can obviously change if you wish e.g. width, height, border. An example of embedding a custom area reporter app can be seen on this page of the Suffolk Observatory.

Reports

The embedding of reports created using Report Builder for ArcGIS is covered here.