Crime data updated 3 June. All affected reports updated by 4 June.
Claimant count
Claimant count data updated on day of publication 16 June. All affected reports updated by 18 June.
Population estimates
The finalised population estimates were released and checked. Only metadata changes were required – see update for May 2020.
Net Housing Additions
The Net Housing Additions data for 2018-19 was added on 15 June.
Notes
With the COVID response demands reducing and a new member of staff joining the Data team we will be aiming to catch up on non-API data sources over the next couple of months.
We are continuing to add processing improvements into the system. These will be rolling out behind the scenes aimed at improving the speed of data being available in the system and the outputs.
March data available in system from 1 May and all affected reports updated.
Claimant count
Claimant count data updated on day of publication 19 May. Reports followed with all affected reports updated by 25 May.
Population estimates
Provisional Population Estimates for large areas for 2019 were released on 6 May. Generally we avoid provisional data to avoid changing numbers. This was an unusual step on behalf of ONS as part of measures to support the COVID-19 response. We made the data available on the 13 May and updated the affected reports by 15 May. The metadata denoted the provisional nature of the figures. ONS released the final version of the figures on 24 June. The only change from the provisional data was additional data for Northern Ireland so the English National Data Service data was unaffected beyond an update to the metadata.
The first step is to sign in to Report Builder. From the Data Catalog Hub homepage click Report Builder (you must have taken a trial of this app from the ArcGIS Marketplace).
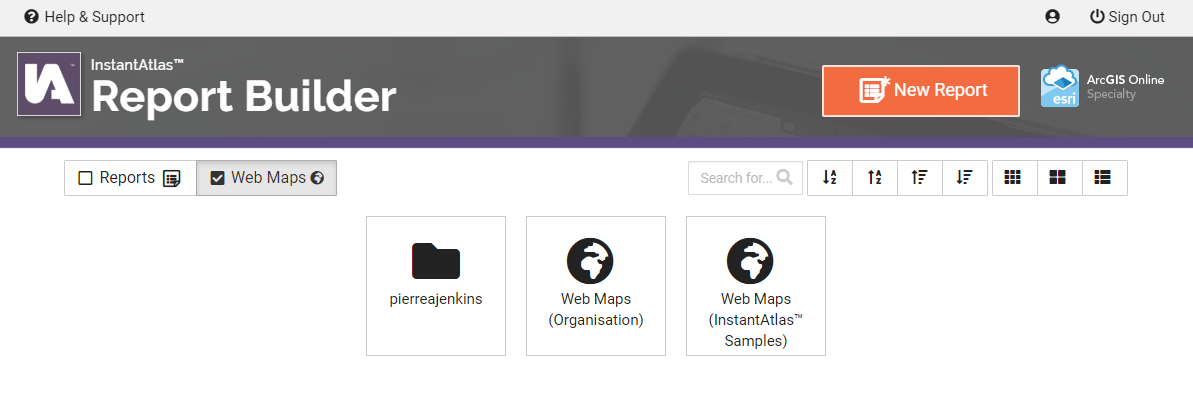
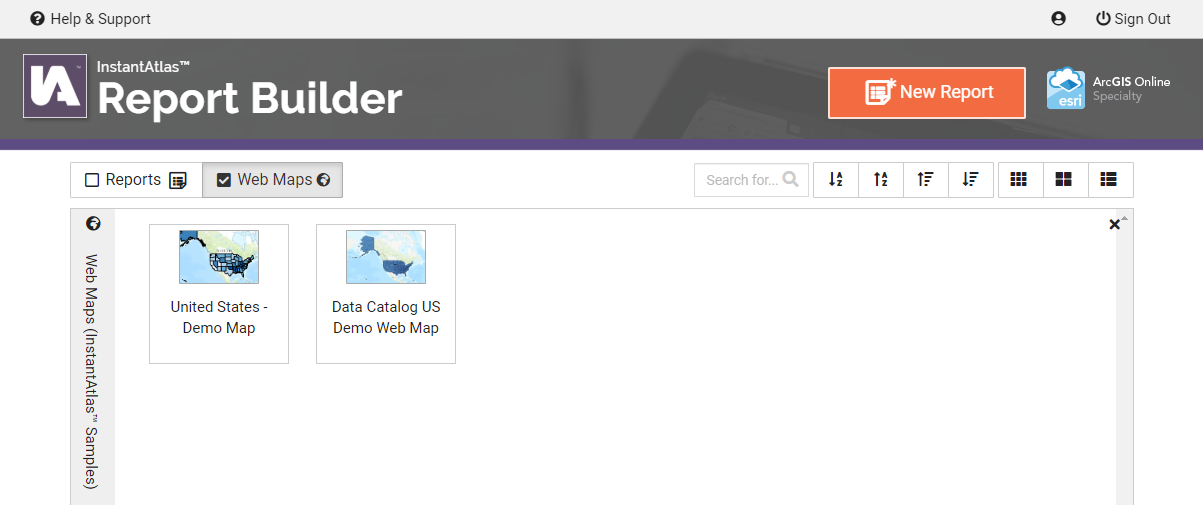
Once in Report Builder, select the Web Maps checkbox in the middle of the page. Then click the Web Maps (InstantAtlas Samples) folder below.
You should see a web map in this folder called Data Catalog US Demo Web Map. That starting point for every InstantAtlas report is a web map. Hover the web map with your mouse pointer and click the Page icon (the middle icon of the three) to create a report based on that web map.
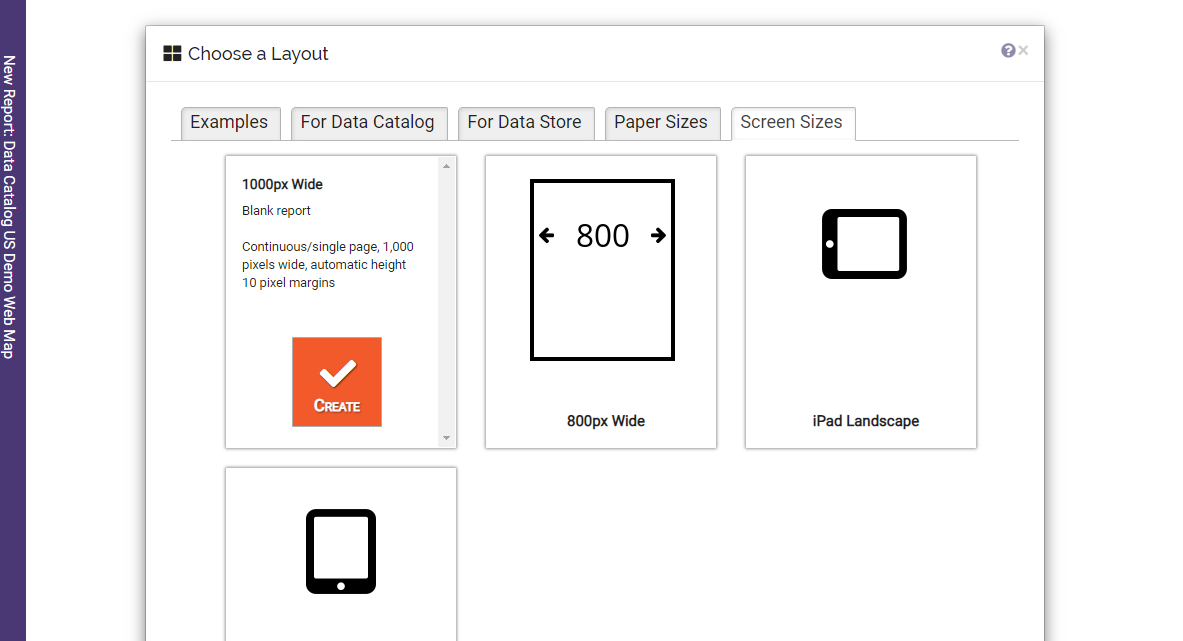
Select the first layout option.
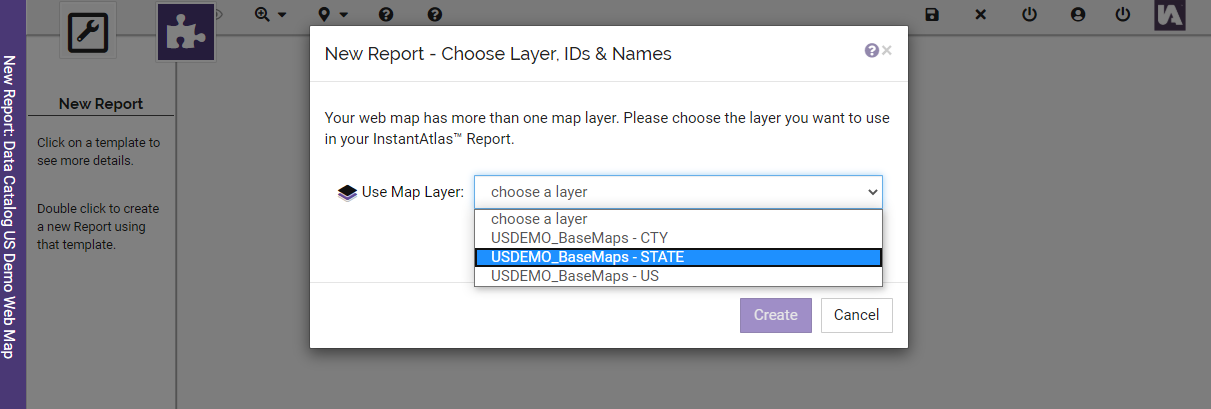
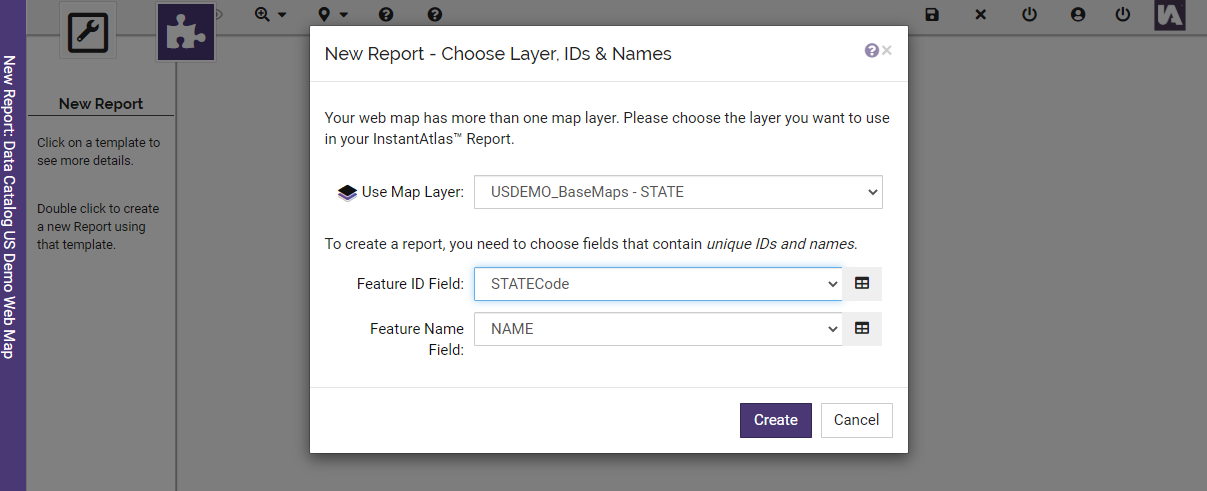
Select the layer you wish to create a report for – County, State or US.
Then select the fields from the layer that contain the IDs and the names of the features in the layer. These are:
County – CtyCode, NAME
State – StateCode, NAME
US – USCode, NAME
In the example shown below the State layer has been chosen.
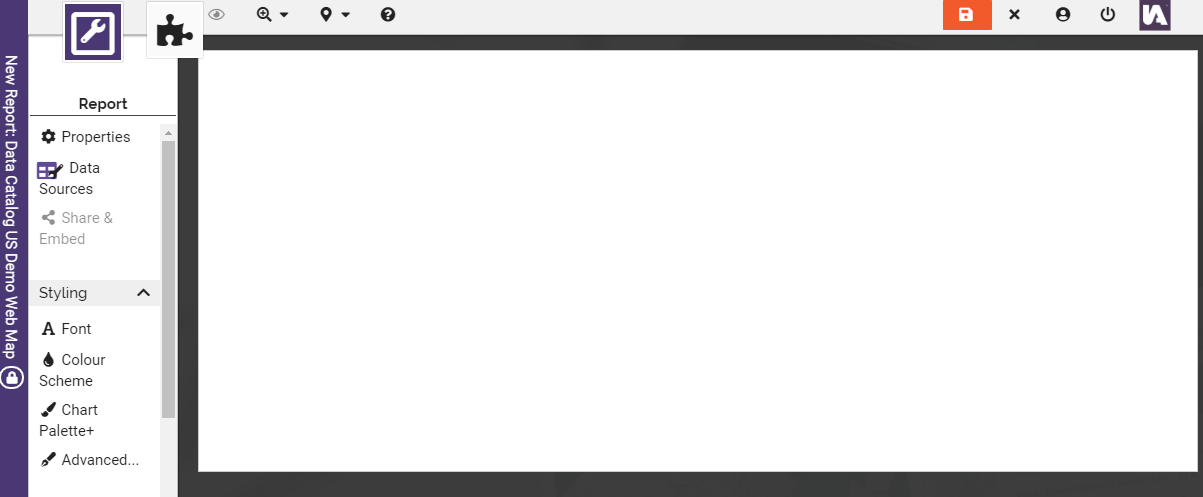
The report will be created and you will be presented with a blank page.
Attaching the data catalog as a data source
You will now see how to attach a data catalog as a data source to a report in Report Builder.
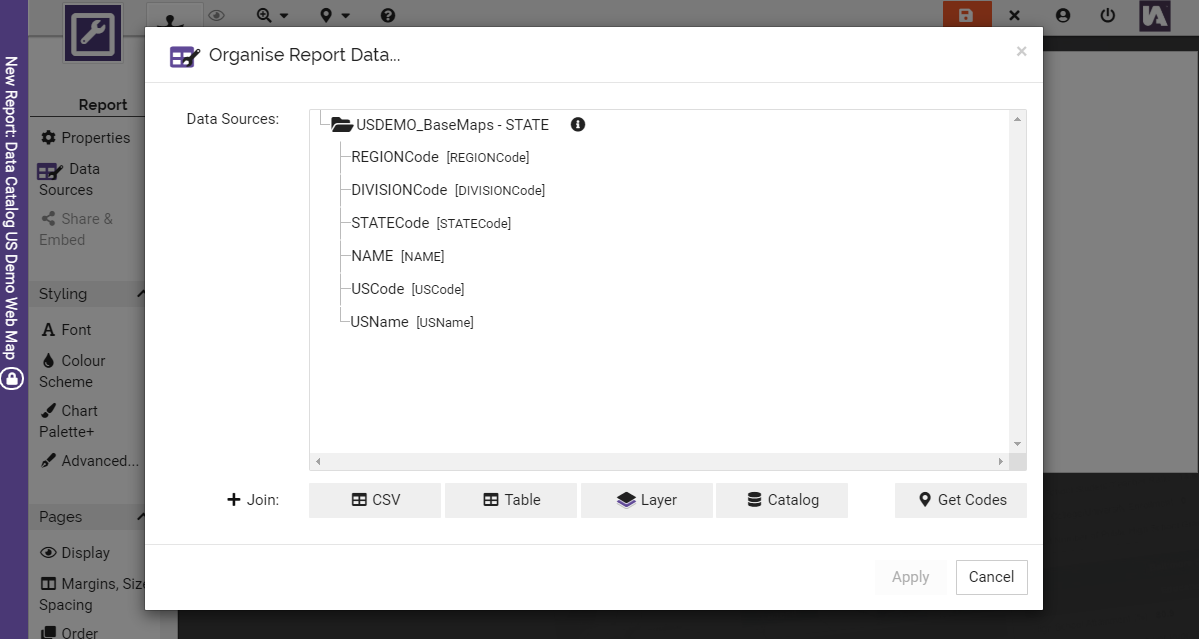
Click the Report Settings and Actions button in the top left-hand corner of the screen. Then click Data Sources.
Click the Catalog button and then click Choose Table.
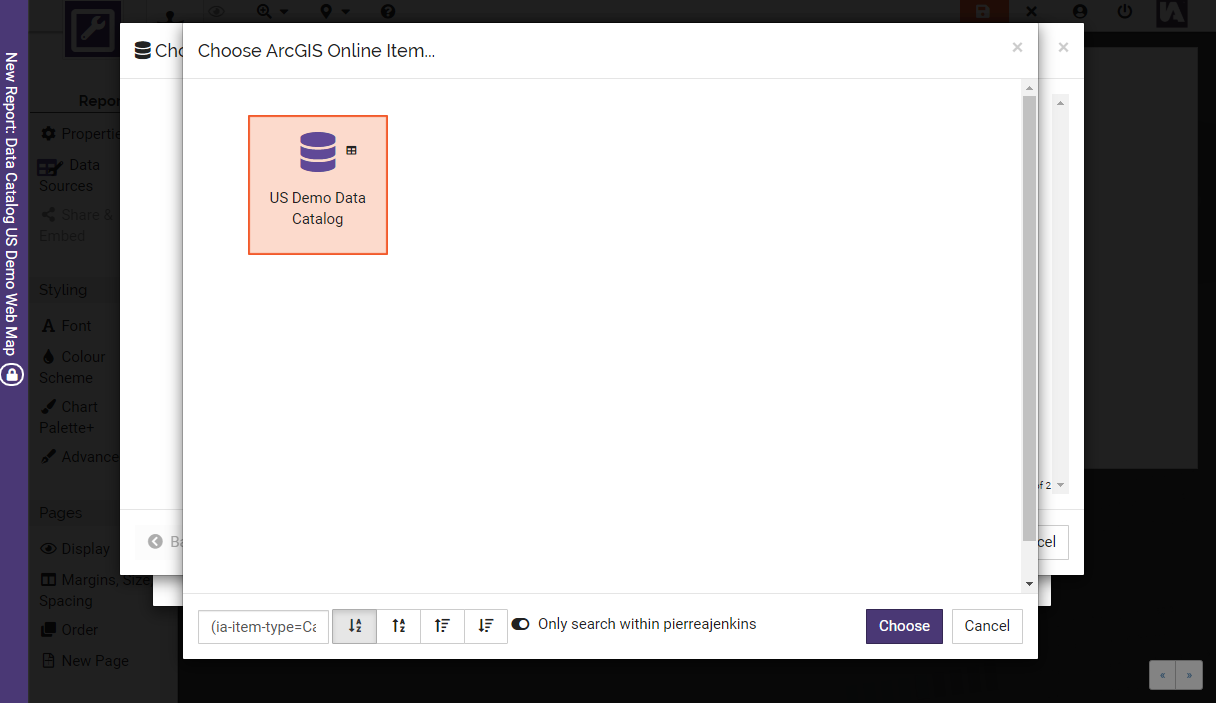
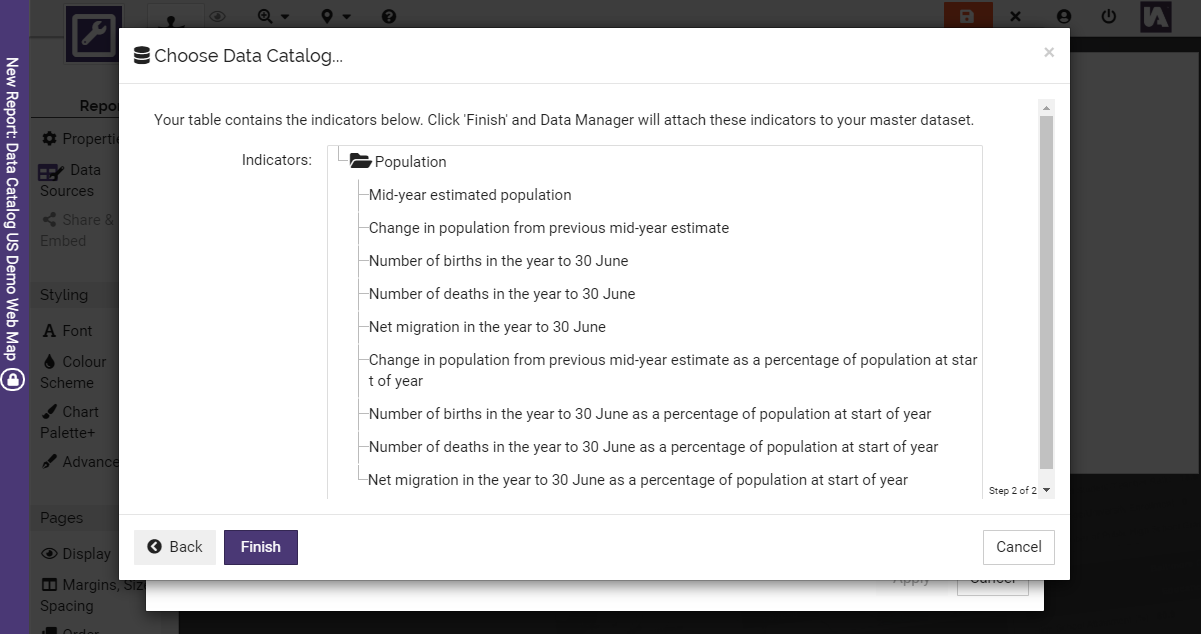
Click on the catalog you created with the US demo data to select it. Then click Choose and Next.
Click the Finish button.
You have now connected the data catalog to the report as a data source.
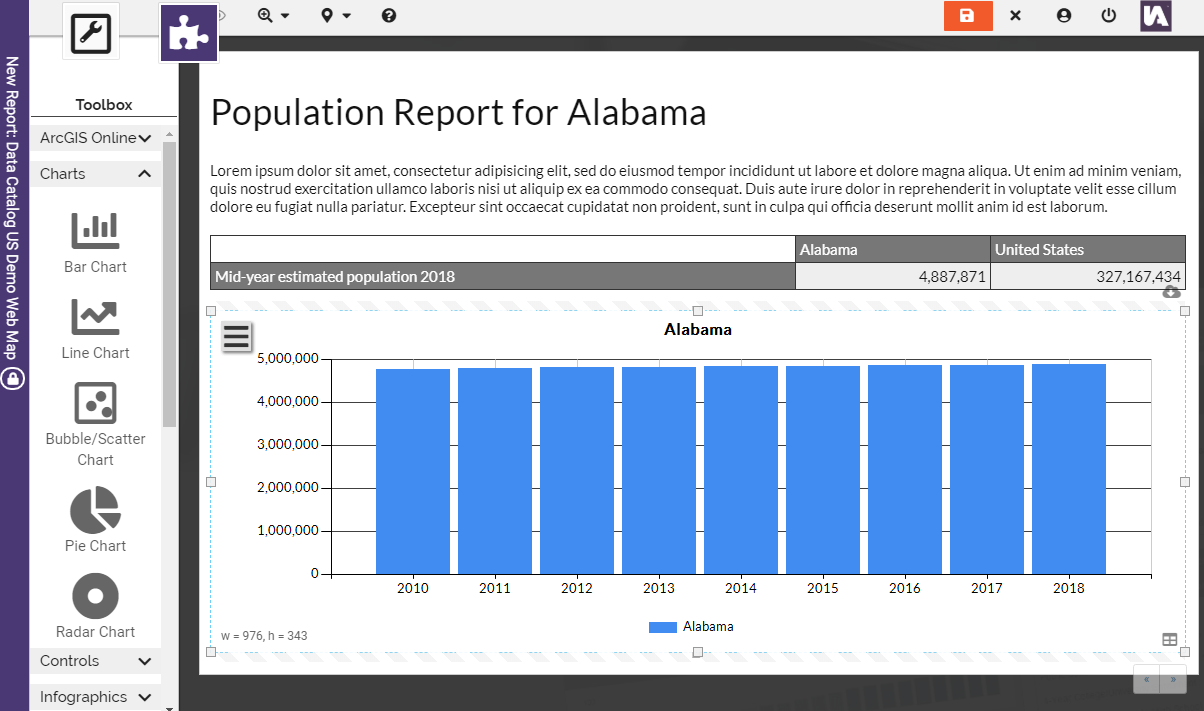
Displaying the data catalog data in the report
You can now click the Widgets button in the top left-hand corner of the page to start dragging widgets onto the report page. Once you have dragged a widget onto the page, you can edit the widget properties, click the Data tab and select indicators from the data catalog.
Version 2.0.1 adds powerful new filtering, user interface improvements and bug fixes.
Enhancements
New functionality to filter features in the active geography using one or more fields in the feature layer. This allows you to filter to the features contained in a larger area (see example given below)
Modal windows now have Apply, Clear and Cancel buttons
Search now launches when user clicks a Go button or hits Enter
Adjustments to size of modal windows and mobile layout
Title and description removed from the list when viewing the Metadata tab (as these are already displayed at the top of the page)
Bug fixes
Search not accepting a space in the search term
Search launching too quickly when typing a term
Filter screen showing incorrect content when the data explorer was set to be filtered to a single root theme in the data catalog (Root Theme ID setting)
Modal window display in Internet Explorer 11
New filtering
Setup
A new configuration setting (Field Filters) has been added that allows the owner of the app to supply a comma-delimited list of filter fields that will be displayed in the data explorer.
Display
The list of field filters is displayed when the user clicks the Filter Settings button in the data explorer. If multiple filter fields have been defined, these will be shown in a drop down menu. If only a single filter field has been defined, this will be shown as text. If a field filter contains the same value for all of the features in the active geography, that field will automatically be hidden from the user.
The end user can select a field to filter the features displayed in the active tab. In the Map tab, the map will automatically zoom to the bounding box of the filtered features. The filter is retained when switching between tabs. In the Time Series tab, the Limit Features button/checkbox will automatically disappear if the number of filtered features is less than 10. The user has the option to perform further filtering to select specific features within the field filter by clicking the Features button.
For example, the Map tab is showing Lower Super Output Areas (LSOAs) for Suffolk County.
The user can filter to the LSOAs in a particular district, for example Ipswich (District=Ipswich). The map automatically zooms to the filtered features.
Switching to the Data tab retains the filter and the table (and the data download) will contain only the LSOAs in Ipswich.
Modal windows
The modal windows in the data explorer have gained Apply, Clear and Cancel buttons to make them more user-friendly.
Claimant Counts for March 2020 with Feb 2020 revision: Released 21 April. On system 21 April. Reports updated.
Annual Population Survey
Annual Population Survey for Jan-19 to Dec-19: Released 21 April. On system 22 April. Reports updated.
Crime
February data released at start of month, March 2020 data released at end of month. March data available in system from 1 May. Reports updated.
Health
Fingertips data has been refreshed across a number of themes. We are aiming to include the Local Health dataset in the next month.
Apprenticeships
Apprenticeship data: Updated with 2018-19 data on 15 April.
Population Estimates
We added the number and percentage of over 70s on 30 March as this is a key COVID response age grouping.
Public Health Outcomes Framework:
The PHOF dataset was updated on 24 Feb with the February data. A change to the processing has led to a number of indicators being reorded. A number of indicators have now been deprecated. These are available in the system but will no longer be updated. We have adjusted the indicator names to include the term DEPRECATED. If you have used these indicators in your reports we advise amending your reports to use the new indicators that will continue to be updated.
Wards
Following discussion with affected customers we are in the process of updating Wards (and other geographies) to the latest boundaries. As there can be a significant delay between new boundaries being released and data being made available for them we will be calculating where possible estimated values for the new areas based on the best fit of smaller geographies. The metadata for affected data will be amended to reflect that the source may be a mixture of published and derived values.
Version 2.0.0 extends the functionality of the data explorer for searching and visualising data in an InstantAtlas data catalog still further by adding powerful charting capabilities and a new redesigned user interface.
Enhancements
Improved interface with tabs to switch between metadata, table, map, time series and ranked bar chart
New charts to visualize indicator data – time series and distribution/ranking
Options to view time series as line, bar or stacked bar chart
Improved mapping functionality – within the app rather than as a separate app – version 4 of JavaScript API replaces version 3
Full control over which features and dates are displayed in the charts and tables
Improved admin/author control over which functionality is available to end users (via ArcGIS Online configure app)
Options to view tabular data in “standard” or “flat” format
Improvements to download of data
Bug fixes
Fixes for bugs when using Internet Explorer 11
Fix for commas in area names breaking data downloads
Other minor bug fixes
Improved user interface
The data explorer has been updated so that all data visualisation options are integrated within the app. Once an indicator has been selected in the data explorer, a series of tabs provide access to the different views:
Metadata: view a description and the full set of metadata for the selected indicator
Table: view the selected indicator for all available features and dates, and download as a CSV file
Map: view the selected indicator as a thematic map with different classifications available including shaded areas and proportional circles
Time Series: view the time series for the selected indicator using a line, bar or stacked bar chart that can be downloaded
Ranked Bar Chart: view a bar chart ranking the features for the selected indicator
Controls
Each view can be customised by the end user via a series of controls located at the top of the tab. These controls are hidden by default but can be displayed by clicking the cog wheel icon.
Select geography menu: use this menu to select from the list of available geographies
Select dates: use these menus to select the range of dates you would like to view data for
Filter features: use this button to access the list of features belonging to the active geography and use the checkboxes to make your selection. Click X to apply the selection.
Table format: choose between Standard and Flat formats for the data
Download: download the data as a CSV file that can be opened in another package such as MS Excel for further analysis.
Table
The table by default will show data for all dates available for the selected indicator, for all of the features in the active geography. The end-user can filter the features and change the date range using the controls above the table. The table can be scrolled if there are too many features/dates to show on the screen. The download button will download the table as a CSV file; only the data showing in the table when the button is clicked will be downloaded.
Map
The map will show data for a single date for the selected indicator, for all of the features in the active geography. The end user can change the geography, select a different available date for the indicator and change the map classification. The map is interactive and can be dragged and zoomed. There are a number of options available from the map area:
Home: return to the default map extent
Export: export the map as an image or a PDF – there are various options to change the layout, or add a title and other text
Basemap: change the basemap for the thematic map
Search: type in the search box to search for a feature in the active geography or a place in the map area
Time Series
The chart will by default show data for all dates for the selected indicator, for up to 10 features in the active geography. The end user can change the date range and filter the features using the controls above the table. They may also click the checkbox to remove the 10 feature limit, although this may create a messy chart depending on the number of features in the active geography. There is a menu to change the type of chart:
Line: a separate line is shown for each feature
Bar: a separate bar is shown for each feature
Stacked bar: one bar is shown for each date and features are stacked
Ranked Bar Chart
The ranked bar chart shows the data for a single date for the selected indicator, with a bar for each feature in the active geography. The end user can change the selected geography, date, filter the features or download the chart as an image.
Metadata
The metadata tab displays the description and the full set of metadata for the selected indicator. This can be download as a CSV file using the download button.
Improved update process for indicators supplied by the InstantAtlas National Data Service but referenced in a customer-managed catalog/master table.
Improved (more fine-grained) error checking in the Inspector tool
New “Repair” functionality in the Inspector tool to allow repair of common errors
Minor UI updates
Bug fixes:
Fixes for issues in the Manager tool that prevented update of InstantAtlas National Data Service indicators and/or caused duplicate indicators and themes in the customer-managed table.