Overview
Comparison data are usually regional or national averages of your indicators which you would like to display in your dashboard.
You can add comparison areas via your feature layer or CSV files. Please note that while you can use multiple sources of data together in a dashboard, comparison data will always depend on the currently selected indicator. Comparison values will thus be taken from the same source as the indicator (e.g. a CSV file) if available and will be displayed as ‘no data’ if undefined.
| Data Catalog Users Comparisons data are pre-defined in the Data Catalog. If, therefore, you are using Data Catalog data for your dashboard you do not need to follow the steps below. All you need to do is insert the Comparison Table widget into your dashboard and comparison data will be displayed. |
Adding comparison areas via the feature layer
- Add an additional row to your feature layer for each comparison area you want to display in your dashboard. You will probably have to do this in your source data before you make it a feature layer. It is easy to add additional rows to a shapefile using ArcGIS desktop.
- The additional rows should not have any geometry associated with them.
- For each additional row populate it with the relevant comparison data in each data field.
- In your ID field give it an ID beginning with ‘#’, e.g. #US. This tells InstantAtlas to treat it as comparison data. Note if you don’t have a suitable ID column you will need to create one.
- Fill in your name field with a relevant description for your comparison area.
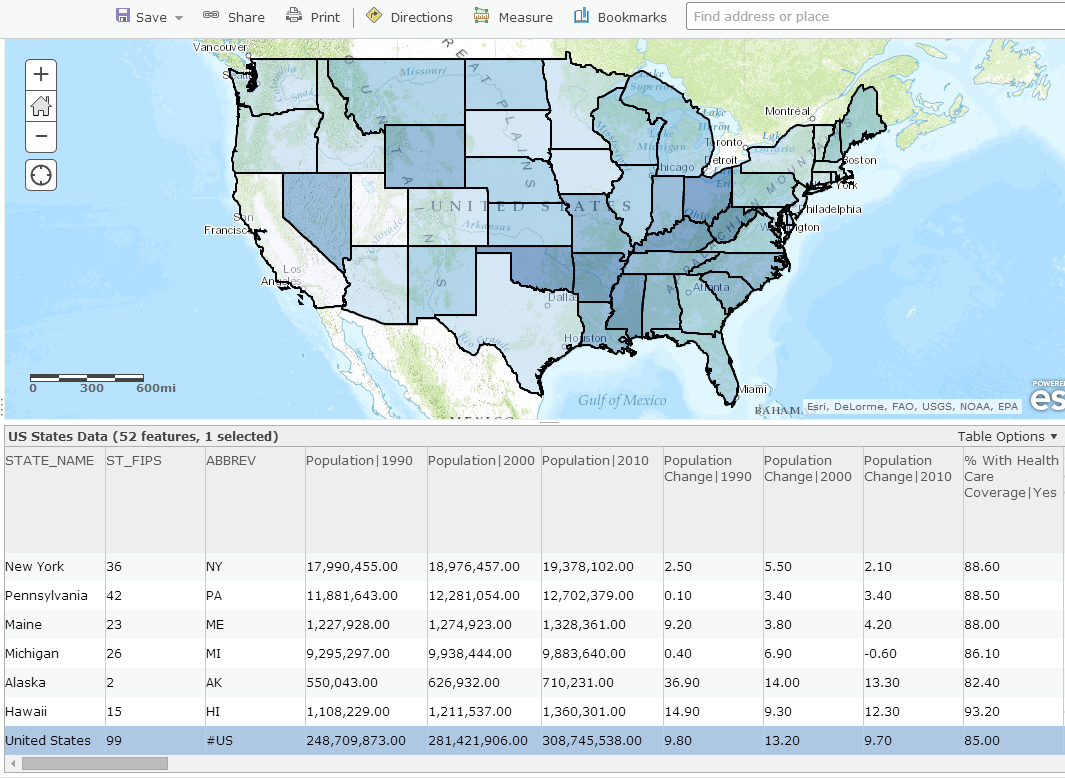
In the data manager you will need to make sure you switch the ID field from the default of ‘FID’ to the ID field that holds your #.
How to set up comparison areas in CSV
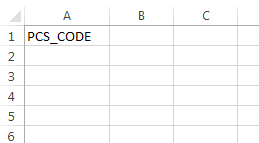
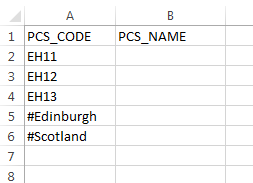
The first two columns of the CSV are where you set the IDs and Names for the comparison areas. In a CSV file,
- define a header for the first column. You can set the header to be identical to the feature service field you use as the dashboard Feature ID (set in the Data Manager). Dashboard Builder will use this common field to create a link between the feature service and the CSV.

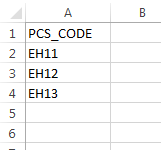
- Copy all records of the Feature ID field from the feature service table to the first column of the CSV. Here the feature service only contains 3 features, their feature ids are ‘EH11’, ‘EH12’ and ‘EH13’.
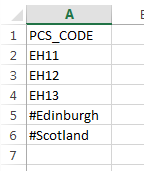
- Specify the comparison area IDs in the first column below the feature service feature IDs. The IDs must be given a prefix of ‘#’ (e.g. #001 or #UK) to distinguish them from the feature service features. Here there are two comparison areas: the City of Edinburgh and Scotland with ‘#Edinburgh’ and ‘#Scotland’ as their IDs.
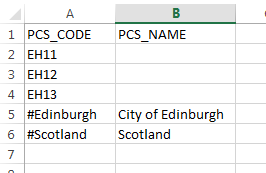
- Now specify the header of the second column. The header name can be identical to the feature service field you use as the dashboard Feature Name (set in the Data Manager).
- Add the names of the comparison areas on the second column. Note you do not need to specify the names for the features from the feature service in the CSV as Dashboard Builder will take the information from the feature service itself.
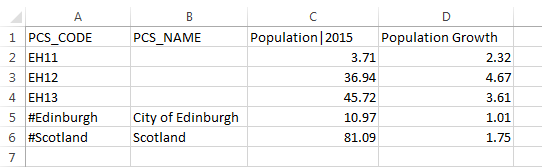
- Once you have set up the first two columns, you can then add the indicators starting from the third column. Note that each indicator set in Dashboard Builder can only retrieve information from one data source, e.g. it is not possible for an indicator ‘Population 2015’ to retrieve field data from a feature service for your geography features and then retrieve field data from a CSV file for your comparison areas. Therefore the indicator values for all geography features must be included in conjunction with the values for comparison areas.
- Once you have finished with setting up all the data for the comparison areas in the CSV file, please refer to the CSV Data section of the Dashboard Builder help pages to link the the CSV file to the dashboard. You will be able to display indicator values for comparison areas in a range of widgets.
Note you can combine CSV files which contain comparison areas with ones which do not contain any comparison areas. However, any CSV files that do contain comparison areas must contain the exact same comparison areas. Even if you do not have data for all of them you still have to add them and leave the data cells blank.