Overview
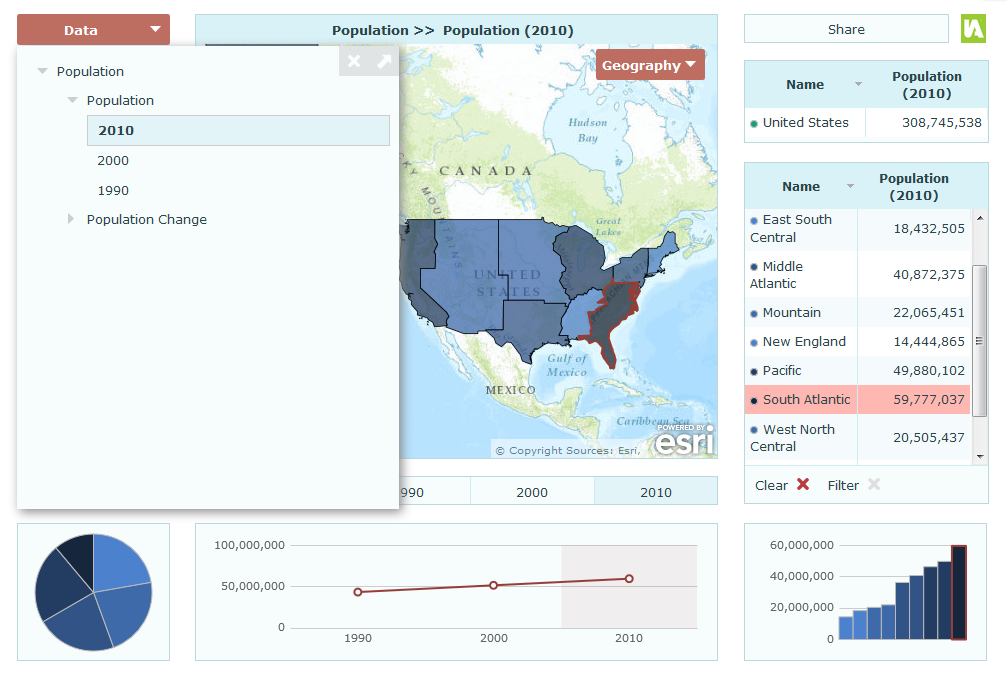
For many indicators you may have more than one time period available that you would like to show in your dashboard e.g. Population estimates for 1990, 2000 and 2010.
InstantAtlas dashboards will show dates nested in the data explorer and will populate the time series chart along with any other time-related widgtes.
How to define time series in the data manager
You can define time series data in the data manager. For each indicator a date can be specified in the edit dialog after clicking the icon:

Indicators with the same name but different dates will be grouped together in the Data Explorer of the dashboard and used in the Time Series Chart.
The following video shows how best to create multiple dates within one indicator:

As the video shows, if you drag and drop items from the left-hand Source Data section onto an existing indicator on the right-hand Data Model section you can choose to add those items as dates for the existing indicator.
Depending on the number of indicators and time periods this way of creating time series can be quite time consuming. A quicker way might be to pre-define the time series in your source data.
Pre-defining time series in the data source (CSV file or feature layer)
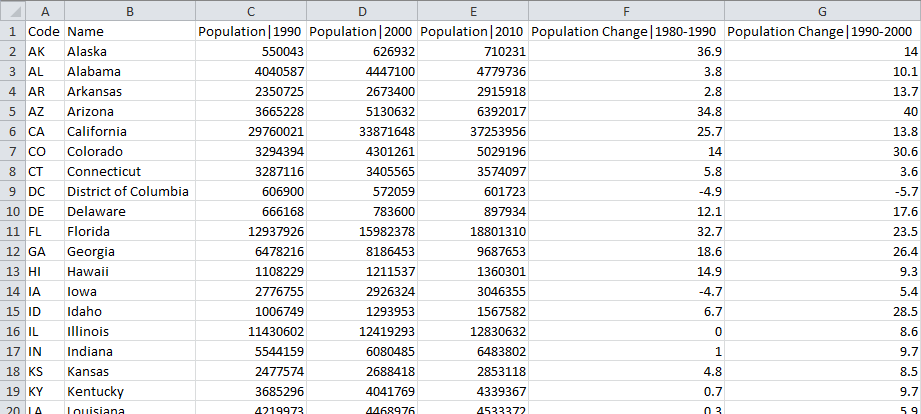
If you are using CSV files as your data source you can pre-define time series by formatting the column headers using this format: <indicator name>|<date> for example Population|2000 or Population|January.
An example of correctly formatted CSV data for multiple dates is shown below:
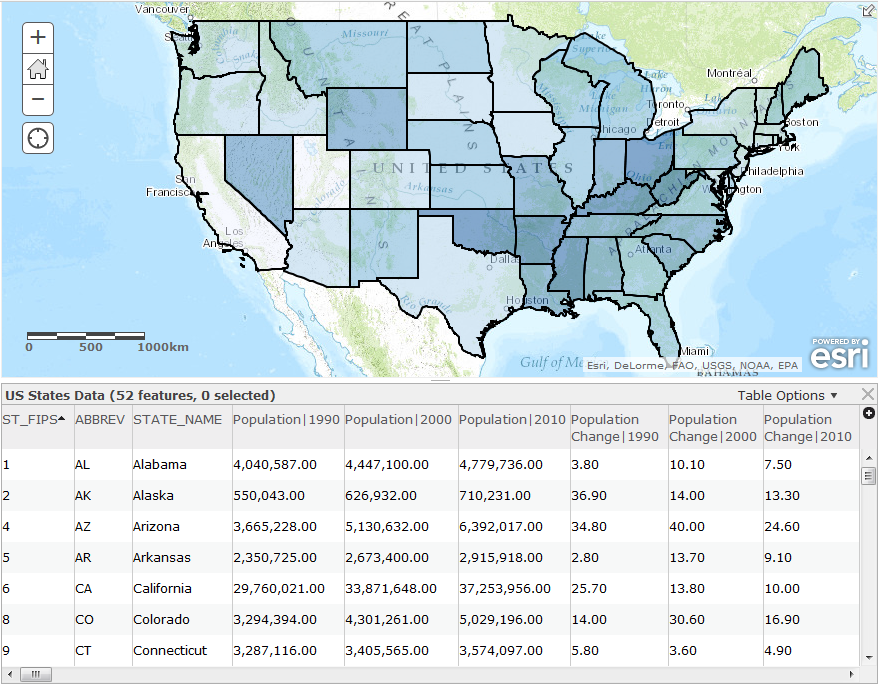
Similarly, if your indicator data originates in the corresponding feature layer and you have the rights to change the alias labels of the column headers, you can pre-define time series data using the same format.
An example of correctly formatted data for multiple dates in ArcGIS Online is shown below.
Dashboard Builder will recognise the text before the pipe symbol ‘|’ as the indicator name and the text after the pipe symbol is treated as the time period label.
To create your data model, all you now have to do is to drag and drop the items from the Source Data section into the respective themes in the Data Model section.

Depending on the column order in your data source, it might be helpful to ensure that the auto-sort switch above the Data Model section is toggled on. This causes the indicators to be sorted alphabetically when they are moved into the data model which also means that indicators with the same name but different time periods are grouped together.
However, if your dates are non-numeric (e.g. month names) you might find that switching off the auto-sort function is more beneficial for you so that the logical order of your dates will be kept.
| Data Catalog Users If you are using data from the Data Catalog, you do not need to define the time periods when you add data to the Data Model. These have been pre-defined in the Data Catalog. All you have to do is select the fields in the Source Data panel and drag/drop them into a theme in the Data Model panel. |