Overview
In the layer manager, you can organise and configure the feature layers of the web map your dashboard is based on. You can access it via the ![]() button of the top menu bar.
button of the top menu bar.
The layer manager allows you to sort each feature layer as either data layer, support layer or hidden layer.
Data Layers
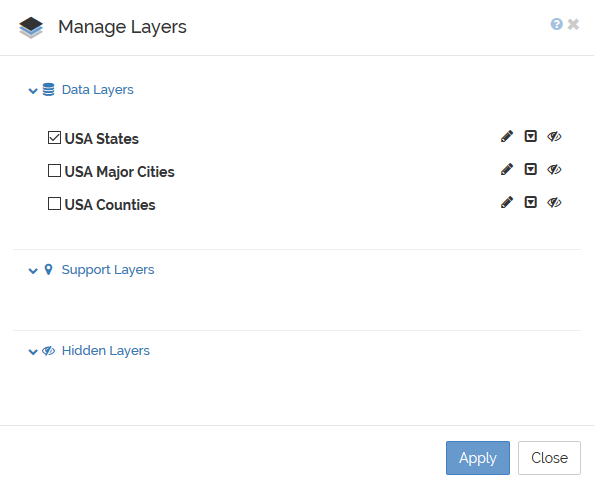
Data Layers are the feature layers you want to thematically map in the dashboard. There must be at least one data layer present. If you have more than one data layer, a ‘Geography’ button will automatically appear in the dashboard that allows you to open the geography explorer to switch between your geographies.
In the example below, the three layers in the web map (US States, Major Cities and Counties) are in the data layer section.
This would result in a Geography menu in the dashboard like this:

The layer whose check box is ticked will appear in the dashboard on start-up. In the example above this is the USA States layer.
Each layer in the data layers section has its own tool menu:
![]() will open the Layer Properties dialog of the data layer in which you can edit a number of properties, e.g. the name of the layer as it will appear in the legend, the opacity and the border thickness.
will open the Layer Properties dialog of the data layer in which you can edit a number of properties, e.g. the name of the layer as it will appear in the legend, the opacity and the border thickness.
![]() will move the data layer into the support layers section.
will move the data layer into the support layers section.
![]() will move the data layer into the hidden layers section.
will move the data layer into the hidden layers section.
Support Layers
Support layers are used to show contextual information. This can for example be a different administrative boundary than in the data layer to provide additional context. You could also use a point layer as support layer to show, for example, major cities in your area.
Support layers don’t interact dynamically with the other dashboard widgets. They are only visible in the map. When their check box is ticked in the layer manager, they will be visible on start-up in the map. If the check box is not ticked they will appear in the legend but need to be clicked first to show in the map.
The tool menu for support layers is similar to the ones for data layers:
![]() will open the Layer Properties dialog of the support layer in which you can edit a number of properties, e.g. the name of the layer as it will appear in the legend, the opacity, and the border thickness.
will open the Layer Properties dialog of the support layer in which you can edit a number of properties, e.g. the name of the layer as it will appear in the legend, the opacity, and the border thickness.
![]() will move the layer up into the data layer section.
will move the layer up into the data layer section.
![]() will move the support layer into the hidden layers section.
will move the support layer into the hidden layers section.
Hidden layers
Hidden layers are feature layers that you have in your web map but which you do not want to appear in the dashboard. The dashboard will ignore all hidden layers.
There is only one tool icon available for hidden layers:
![]() will move the hidden layer back to the section it was previously in (data layers or support layers).
will move the hidden layer back to the section it was previously in (data layers or support layers).
Layer Properties dialog
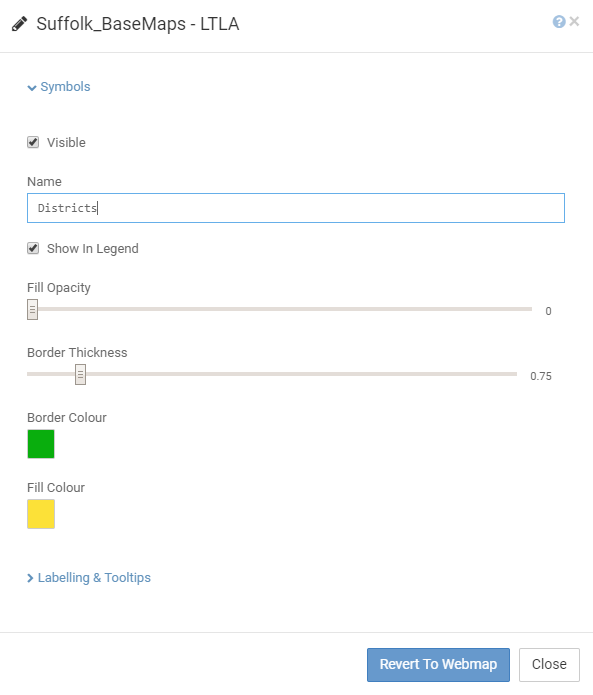
The settings in the layer properties dialog are organised in two groups: Symbols and Labelling & Tooltips. to apply your changes you need to select Close at the bottom of the dialog and then Apply in the Layer Manager. You can also revert the layer settings back to those from the web map by clicking on the Revert To Webmap button.
Symbols

Here you can change the layer name as it appears in the legend widget. You can set whether the layer should be visible on start-up and you can define the symbology by setting the fill opacity, border thickness and border colour. For support layers, you can also set the fill colour. For data layers, the fill colour is determined by the displayed data and the colour palette set in the Legend Properties.
Labelling & Tooltips
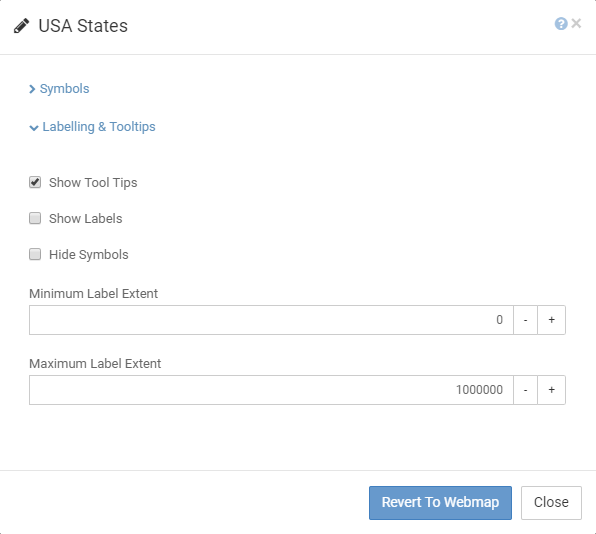
Here you can decide if the layer should show tooltips and/or labels.
For a data layer, the label will show the names of the map features as set in the name field in the Data Manager. Tooltips of a data layer are defined in the Tip property of the map widget.
For support layers the Labelling & Tooltips property group contains an additional drop down list where you can pick the attribute field to be used for the tooltips / labels.
If you want to create a layer that only displays labels but not symbols you can switch the symbols off by ticking the ‘Hide Symbols’ checkbox.
The Minimum and Maximum Label Extents allow you to define at which zoom extents labels should become visible. The values are map units visible in the width of the map widget.
Please note
The layer order from your web map is always kept in the dashboard. That means that a support layer can either be shown above or below a data layer, depending on their sorting in the corresponding web map.
It is advisable to move the support layer above the data layer(s) in the web map. If the support layer is a polygon layer, you can remove the fill opacity from the layer so that the data layer is not obscured. Rather, just the borders of the support layer will be visible on top of the data layer. To do this, edit the support layer and drag the Fill Opacity slider over to the far left as shown in the example below, then click the Close button.