Overview
The Data Manager allows you to select and structure the data that you want to display in the dashboard. The Data Manager of all data layers can be accessed via the Data button ![]() at the top menu.
at the top menu.
The Data Manager screen consists of two panels: the Source Data and the Data Model. At the top of the screen is a menu that states the geography that you are managing data for. If there are multiple feature layers in the web map, and you have selected more than one of these to be a data layer using the Layer Manager, you will be able to switch between different geographies using the menu at the top of the screen.
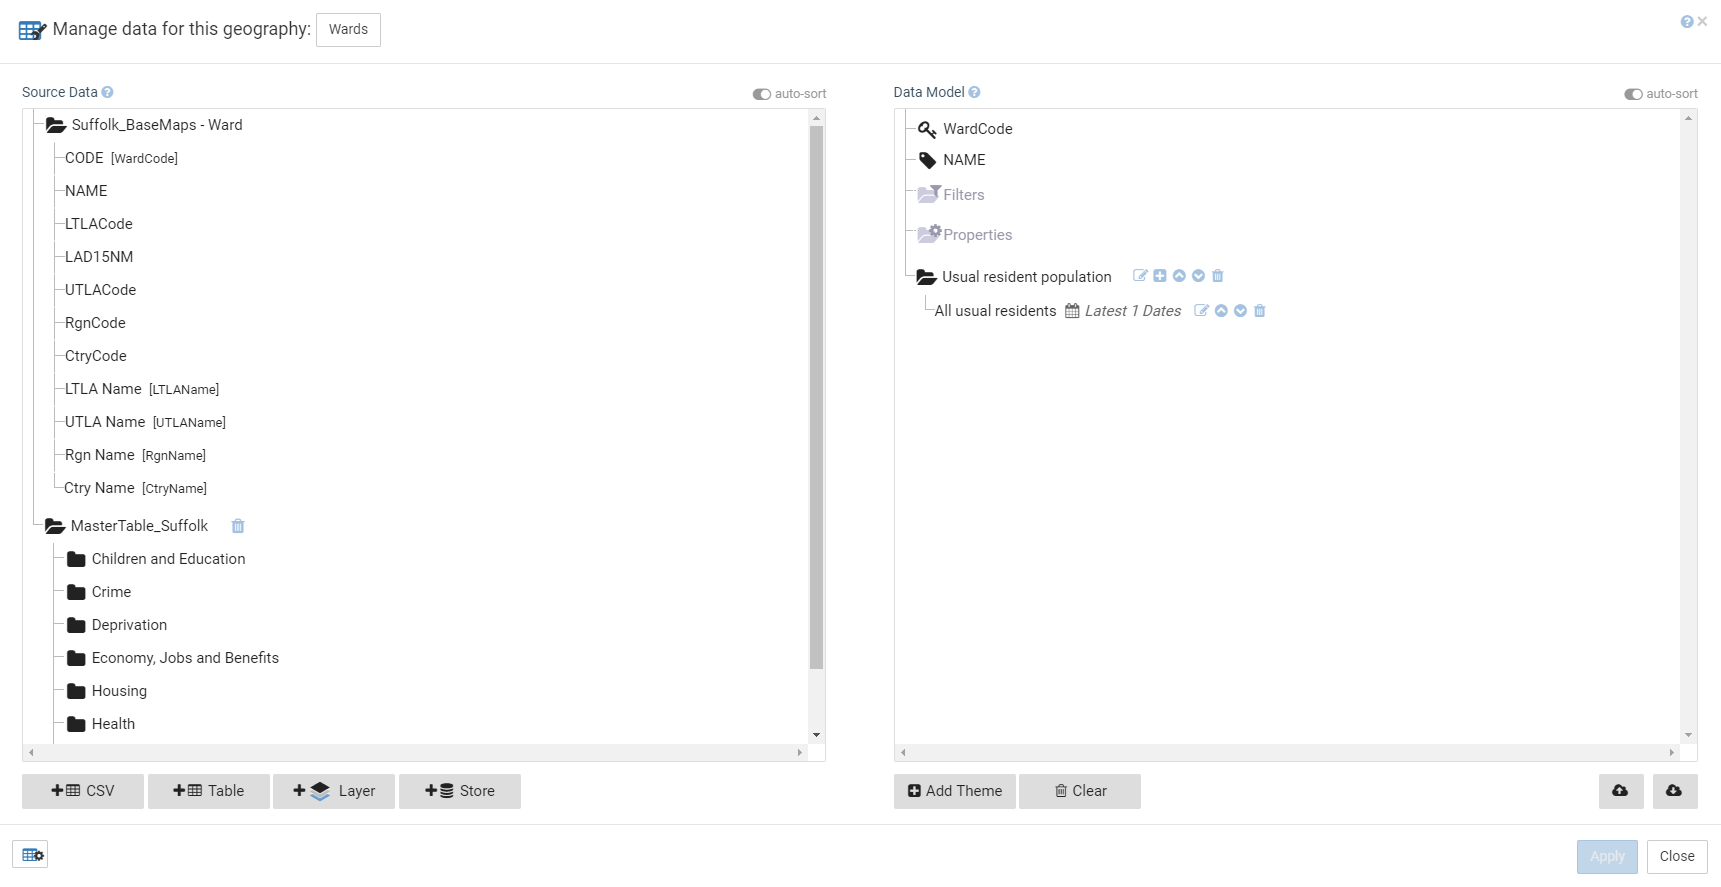
Source Data
The Source Data panel uses a folder system to list all the data that are available for use in your dashboard for the selected geography. There are different sources for the data:
- Feature Layer
Data contained in the feature layer will be listed first in the Source Data panel. All feature layers contain a list of table attributes which may be used as indicators in the dashboard.
- CSV Files
There are two ways you can add a CSV file to the Source Data panel: from ArcGIS Online or from a CKAN portal.
- Tables
Data can be added from an ArcGIS table with data organised in rows and columns.
- Layers
Data can be added from further ArcGIS feature layers or services. Geometry is ignored and data are joined as if they were in a table.
- Data Catalog
A Data Catalog is a collection of tables and feature services in ArcGIS Online created and used by GeoWise to manage national and client’s datasets.
In most cases Data Catalogs contain data from the National Data Service. This service collects and manages useful publicly available data (currently only for the UK) and keeps them up to date. The National Data Service includes datasets such as census tables, mid-year population estimates, benefit claimant counts, crime statistics, educational attainment figures and so on. For more information about the Data Catalog and National Data Service please contact support@geowise.co.uk.
| Data Catalog Users Data Catalog users that have created their dashboard using the Data Catalog option will find that the Source Data panel is automatically populated with data from the Data Catalog. Typically therefore, these users will not need to manually add data to the Source Data panel (although they can do if they wish). |
Data Model
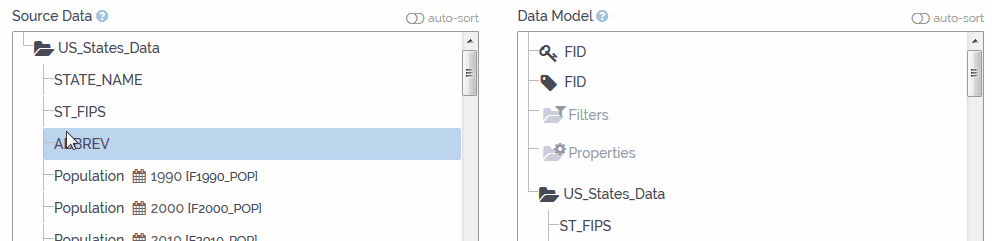
The Data Model panel on the right hand side shows the list of data that will actually be displayed in the dashboard. By default, all fields from the feature layer for the selected geography are listed here. To add further data, simply click and drag them from the Data Source panel into the Data Model panel.
Feature ID Field
You can assign one of the fields of your feature layer as feature IDs. Feature IDs are needed as common identifiers if you want to use any CSV data or comparison areas. The field that is used for feature IDs should hold unique values for all your features. If you do not plan to connect an addtional data source besides your feature layer (such as CSV files, ArcGIS tables etc.) or comparison areas you do not need to assign feature IDs.
After adding an additional data source such as a CSV file you will not be able to change your feature ID again.
Name Field
One field of your feature layer should be assigned as a Name Field. This field will then determine the names of the features in your dashboard as they appear for example in the first column of the table.
Filters
If you like you can assign one or more fields from your feature layer to the Filters section. This field should group the available features into different categories, for example counties could be grouped into regions. As soon as a field is assigned as a Filter a filter button will automatically appear in the dashboard. Clicking on this filter button will open the filter explorer which lists all categories of the filter field. Applying a filter category (e.g. a specific region) will then suppress all features that do not belong to this category in the map and the associated widgets. The filter can then be cleared by clicking the corresponding button in the map or table.
Properties
You can assign fields to the Properties section that include data that are the same for all of your features, independently of the indicator data. The properties can then be displayed in map tooltips or data table columns.
Data hierarchy
Below the Properties section you can add the data to the dashboard.
The data hierarchy consists of themes, indicators and indicator dates. Indicator dates are not mandatory but can be used if you want to display time series data. It is also possible to add associates to your indicators that provide additional information or play a supporting role.
- Themes are the highest elements in the hierarchy and are used to group indicators. A new theme can be added by pressing the ‘Add Theme’ button at the bottom of the data manager. When hovering over a theme name with the mouse cursor several editing icons appear:
- : click this icon if you want to rename your theme
- : click this button to add a sub-theme to your data hierarchy. Every theme can have several sub-themes (and sub-sub-themes). Every sub-theme must include at least one indicator.
- : use these icons to move your theme up or down in the data hierarchy
- : click on the bin icon to permanently remove your theme. Please note that deleting a theme will also remove all indicators and associated data within the theme as well.
- Indicators hold the data you want to map in your dashboard. To add a new indicator to your data model drag the corresponding field from the data source on top of the theme you want to assign the indicator to. Once the indicator is in the data model, you can edit it by clicking on one of the editing icons that appear when you hover over the indicator name:
- : click on this icon if you want to rename the indicator, add or change the indicator date or change the data type of the indicator. The data type can be either numeric or categoric. By default, indicators from feature layers will use the data type that was set up in the feature layer for the corresponding field. Indicators from CSV files will always be regarded as numeric if you do not change this setting. To save your changes, please click the save button. To discard your changes, click on the cross symbol.
- : Use these icons to move the indicator up or down within the theme.
- : click on the bin symbol to delete this indicator. Please note that when you delete an indicator all corresponding associates are deleted as well.
Practical advice
From a practical point of view the following steps are recommended when building your data model:
- If you plan to use CSV data or comparison areas assign a suitable feature ID field.
- Assign a Name field.
- Clear the data hierarchy that you got when first creating your dashboard. It is very likely that you want to arrange your data in the data model in a different way. Please note: pressing the clear button will only affect the data hierarchy, the filters and properties but not the feature ID field or the name field.
- Think about how you want to group your data and add themes in which you want to sort your indicators.
- Drag the indicators you want to map in the dashboard from the data source to the corresponding themes. The Shift key will allow you to select and drag several indicators at once.
- Make sure that your indicator dates (if you have any time series data) and the data type of the indicators (numeric or categoric) are correct.
- Add filters or properties if you like.
- Once you are happy with your data model, press the Apply button. Be careful – if you hit the Close button instead you will lose all of the changes that you have made!
- You might want to download the data model file by clicking to save it to your PC for safety or to upload it to a different dashboard. To upload a data model file, please click .